Monday, February 17, 2014

Aluminium swings from surplus to deficit.

Aluminium swings from surplus to deficit.
With production trailing consumption, stocks are depleting and market balances are tightening
After seven-eight years of acute oversupply, the world aluminium market is now undergoing a structural change from surplus to deficit. An extended period of overcapacity has been a feature of the world aluminium market for some time now.

No doubt, producers in the western world have cut back output but their efforts have been largely neutralised by new capacity additions in China and West Asia. The result has been sustained downward pressure on aluminium prices.

No wonder, LME prices have continued to remain in a narrow range of $1,700-1,900 a tonne.

With long waiting time or queue at LME warehouses, producers were compensated, albeit partially, by the rise in aluminium premiums; but that too is beginning to decline with the LME proposing new rules of warehousing and delivery scheduled to take effect from April 1, 2014.

With production trailing consumption, stocks are beginning to be drawn down, and market balances are tightening.

There is a swing in ex-China balance to deficit this year (estimated at 1.3 million tonnes). Yet, excess capacity in China continues to weigh on the market.

The world aluminium market is struggling to come to terms with, on the one hand, a structural shift from surplus to deficit exceeding one million tonnes expected this year and the next; and on the other, freeing up of up to 1.4 million tonnes of the metal over the next two years following changes to LME warehouse rules.

Even as the Chinese continue to combat overcapacity, the key question is whether the western world will cut output any further without which output growth may increase.

According to industry experts, planned aluminium production cuts have soared since the announcement of the new LME warehousing policy which will eventually reduce smelter profits via lower physical premiums.

Production cuts ex-China have totalled close to 2.4 million tonnes a year of capacity since the beginning of 2012, leading to a sharp change in the market balance from surplus to deficit.

Potential for price rise
From the demand side, global demand growth is expected to be strong in the next two years (4-5 per cent) thanks to continued growth in BRIC countries and a rebound in G3 demand.

Leading indicators and improvement in global manufacturing confidence support the expectation.

The US is expected to see demand growth of about 3 per cent per annum, while Europe could be something of a wild card because with fiscal austerity less of an issue now, it is possible that European demand may bounce if households and corporates begin to replace durable goods, such as vehicles, and plant and machinery. The US Fed tapering and anticipated dollar firmness is likely to pressure metal prices.

Yet, for aluminium, from here on, if there is a directional change in prices, it is to the upside.

From the recent levels of around $1,660/tonne, aluminium prices have the potential to rise about 5 per cent in H1 and another 5 per cent in H2 this year.
For 2014, the average price of LME aluminium is projected at $1,800 per tonne and for 2015 at $2,100/tonne. Buying on price dips is recommended.

For these prices to sustain, of course, steady flow of positive macro-economic data would help. From an Indian perspective, demand for aluminium has the potential to grow 10 per cent per annum over the coming years even as the country is likely to remain a net importer for two-three years more.

With higher domestic supplies of raw materials, there is scope for stronger Indian demand.At the same time, a weakening rupee will benefit exporters of raw material alumina.

Codelco’s challenges escalate as workers reject contract offer

Codelco’s challenges escalate as workers reject contract offer


Workers at Chile’s copper producer Codelco, the world’s largest copper miner, have rejected the company's wage proposal presented during early collective contract negotiations, deferring union labour talks to October.
About 4,300 miners (or 51.2%) of El Teniente division turned down the contract offer, which in addition to base salary, included a bonus and soft loans (those offered at very low or zero interest rates) worth around $30,700. The union is asking for better long-term benefits and equal access for all workers to the company’s benefits regardless of when they joined.
Rough patch
El Teniente was the company's most productive deposit between January and September last year, mining 327,000 tonnes of red metal in the period. But Codelco is currently  facing tough times due to sinking copper prices, lack of cash and escalating costs.
The copper giant gives all its profits to the state and had been severely disappointed by the original amount of money it was returned.
As a result, Codelco decided last year to seek outside financing to implement its $27 billion investment plan for 2012-2016, and placed a $750 million bond in August.
Chile expects mining investment to reach $112 billion by 2021, figure that includes $27bn in projects planned by Codelco. By the same year, the country’s total copper production is projected to reach an annual 8.1 million metric tons.
As a back-up plan, the Chilean copper giant is exploring a more aggressive incursion in the silver market. Last November, CEO Thomas Keller said Codelco aims to become one of the world’s ten largest producer of the precious metal as soon as its touted Ministro Hales mine begins production later this year.
The nearly $3 billion copper-silver mine is expected to add 300 tons of the precious grey material to the existing silver output from the rest of Codelco’s operations in the country.
The firm owns about 11% of the world's copper reserves. The red metal accounts for 60% of the Chile's exports and 15% of its gross domestic product (GDP).

Saturday, February 15, 2014

RBI tightens gold import norms under 80:20 scheme.

RBI tightens gold import norms under 80:20 scheme.
Seeking to restrict gold imports, the Reserve Bank today said nominated banks and agencies will not be allowed to import the precious metal in excess of their entitlements in first or second lot under the 80:20 scheme.

"Import of gold in the third lot onwards will be lesser of the two-- five times the export for which proof has been submitted or quantity of gold permitted to a nominated agency in the first or second lot," RBI said in a notification.

The government under the 80:20 scheme had in August 14, 2013, allowed nominated agencies to import gold on the condition that 20 per cent of the inward shipment will be exported. The permission to import the next lot would be given on fulfilment of export obligation.

In view of the representation being received by the RBI and the Finance Ministry, the central bank has said that the quantum of the third lot import would be five times the export from the previous lot subject to the condition that it would not exceed previous entitlements.


In case of advance authorisation (AA) and duty free authorisation (DFIA) for gold import issued before August 14, 2013, RBI said the 80:20 rule will not apply for units in Special Economic Zones (SEZs), Export Oriented Units (EoUs), Premier and Star Trading Houses.

"The imports made as part of the AA/DFIA scheme will be outside the purview of the 80:20 scheme. Such Imports will be accounted for separately and will not entitle the nominated agency/banks/entities for any further import," RBI said.

To contain rising gold import, which was 162 tonnes in May, the government had hiked import duty on gold thrice in 2013 taking it 10 per cent. Besides, the RBI also came out with certain restrictions, including the 80:20 scheme for imports. The gold imports came down to 19 tonnes in November. 


Tuesday, February 11, 2014

Base metal demand to remain 'reasonably strong', says JP Morgan

In the research report published Friday, leading investment bank JP Morgan forecasts that the base metal demand from China should remain ‘reasonably strong’ in 2014, although down from 2013. The demand growth will be boosted by recovery in developed markets, says the research report.
JP Morgan estimates the global copper usage growth to decline to 5% in 2014 as compared with the 10% in 2013. Also, the global aluminum usage growth is expected to decline to 8.2% from 11.5%. According to the report, the global manufacturing sector may continue to grow with strong momentum. However, the Chinese base metal demand will remain lower when compared with 2013.
With regards to copper, the huge mine supply growth has lead to high stocks of copper concentrates in 2013. The conversion of these stocks to refined copper is the key. There are probably high chances that China may witness production ramp-up following the New-Year holidays.
Meantime, the copper inventory levels continued to wane in Europe. The copper stocks in LME-registered warehouses fell 2,225 mt on Friday to touch 308,025 mt. 
Also, Port Strike in Chile has considerably reduced the shipments, thereby keeping the premiums at reasonably higher levels.

Saturday, February 8, 2014

DJ-UBS Commodity Index Is In Breakout Mode. Dollar Index To Struggle.


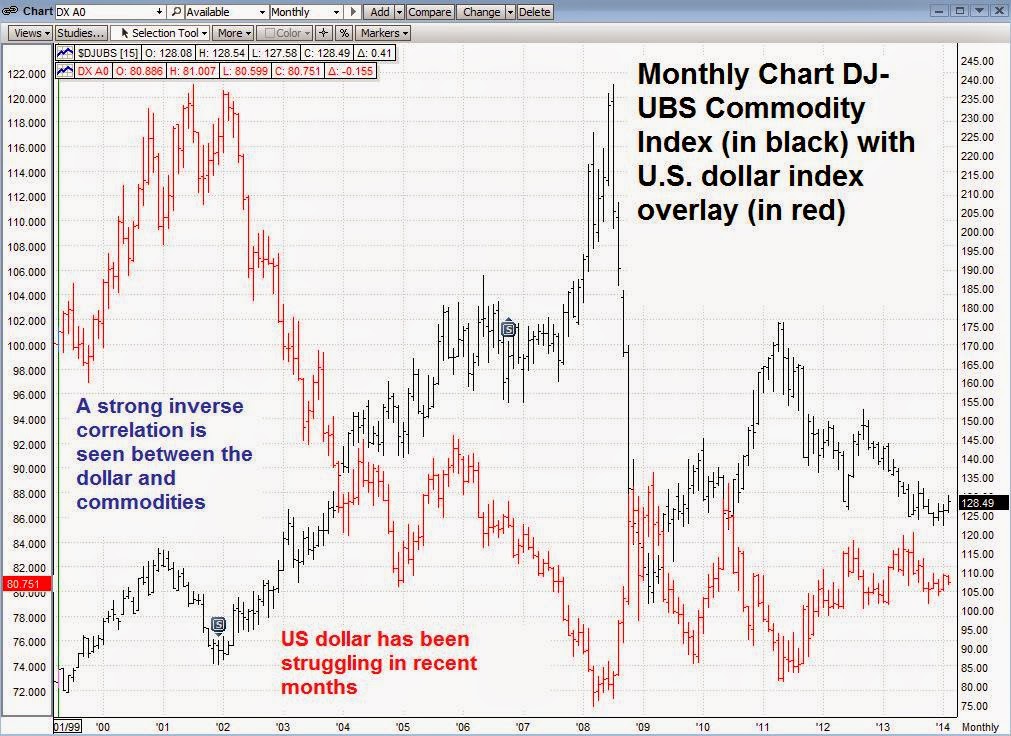
Let's take a look at the dollar/commodity correlation. It's no secret that the U.S. dollar index has an inverse correlation to the commodity markets. Figure 1 below shows that well. This reveals a monthly chart of the DJ-UBS Commodity index (in black) with an overlay of the U.S. dollar index (in red).
DJ-UBS Commodity Index Is In Breakout Mode. Dollar Index To Struggle.

Despite widespread expectations, really for months now, that the U.S. dollar would rally strongly, the U.S. dollar index has been stymied be resistance at the 81.50 area. Meanwhile, the DJ-UBS commodity index has formed a double bottom reversal pattern (seen on the weekly chart) in Figure 2 below. The index is testing the breakout point right now and this will be an important zone to watch.
DJ-UBS Commodity Index Is In Breakout Mode. Dollar Index To Struggle.
Bottom line? The U.S. dollar has struggled. Commodities, as an asset class, are trying to rally off a weekly double bottom, and gold has been one of the top five commodity performers of January. If the U.S. dollar index remains stymied by resistance in the 81.50 area and that weekly double bottom on the commodity index chart confirms—that would be bullish news for gold and commodities.

Dow Jones Index 1929 And 2014 Graph. Will History Repeat Itself ?

Dow Jones Index 1929 And 2014 Graph. Will History Repeat Itself ?

Dow Jones Index 1929 And 2014 Graph. Will History Repeat Itself ?

Dow Jones Index 1929 And 2014 Graph. Will History Repeat Itself ?