Monday, November 18, 2013

The Magic Of Fibonacci

Retracement-Fibonacci
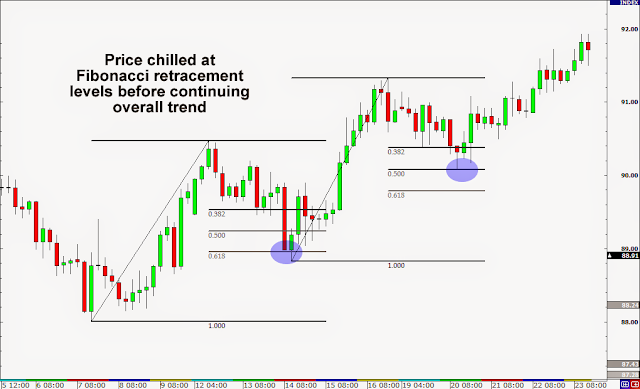
The most common method in which the Fibonacci numbers are used in trading stocks is through Fibonacci retracement. The retracement levels are based on these ratios; 0.236, 0.382 and 0.618.
There are many in the trading fraternity who swear by the Fibonacci numbers.
Those who have not yet been exposed to this wonder-world can benefit greatly by a smattering of understanding of these numbers, for the stock prices seem to have a great affinity to them.
Leonardo Fibonacci, the Italian mathematician popularised the number sequence called the Fibonacci series through his book Liber Abaci published in the 13{+t}{+h} century.
In this book he used the example of sequence in which rabbits multiply to arrive at the series: 0, 1, 1, 2, 3, 5, 8, 13, 21, 34, 55, 89, 144……
Each successive number in this series is the sum of two preceding numbers.
If we divide one number in the series by the number to the right of it, we get the ratio 0.618.
If a number is divided by the number to its left, we get 1.618. A lot has been written about the significance of the golden ratio (1.618) and its recurrence in nature; in the spiral of galaxies, sea shells, sub-divisions of the human body and so on.
Nature seems to have a preference for the numbers in the Fibonacci series and they are seen in patterns in sunflower seeds, pine cones, petals in flowers, branches in a tree and so on.
It should therefore not surprise a market observer that these numbers are useful in forecasting turning points in stock market as well.
Why is that so? As explained before, human emotions are what drive stock markets. Since humans are part of nature, it follows that stock price movements too follow laws of nature.
The most common method in which the Fibonacci numbers are used in trading stocks is through Fibonacci retracement. In the Fibonacci number series, if we divide a number by another number, two places away, we get the ratio 0.382 and by dividing by the number that is three places away, we derive the ratio 0.236. The farther we move up the series, the closer the relationship gets to these ratios.
The Fibonacci retracement levels are based on these ratios; 0.236, 0.382 and 0.618.   0.55 is added in between, perhaps because 55 is a Fibonacci number and the half-way mark is always a significant support or resistance.
Once a security completes one leg of a move upward, the retracement supports for the correction that follows is calculated by deducting the product of the magnitude of the up-move and the various Fibonacci ratios and deducting these numbers from the most recent peak.
In a down-move the product of the ratios and the distance travelled is added to the most recent trough to arrive at the levels where the security is likely to face resistance.
These retracement levels are equally effective along all time-frames: intra-day, daily, weekly, monthly or quarterly. The frequency with which stocks take support or reverse lower from the Fibonacci retracement levels is truly awe-inspiring and can convert most traders to ardent followers.
Technical Analysis - MCX Copper, NG, Gold, Silver And Crude Oil.

Technical Analysis - MCX Copper, NG, Gold, Silver And Crude Oil.
The MCX gold futures contract is relatively more bullish in the short-term when compared with other commodities. Copper looks vulnerable while silver, crude oil and natural gas are testing their significant 200-day moving average supports.
Gold (Rs 30,332)
The MCX gold futures contract is bullish in the short-term. There is an inverted head and shoulder pattern on the daily chart with the right shoulder being formed now. Support is at Rs 29,700 and the contract can rise to Rs 31,500 in the short-term. A strong weekly close above Rs 31,500 will confirm the pattern and turn the medium-term outlook also bullish for the targets of Rs 33,200 and Rs 34,000. On the other hand, if the contract falls below the immediate support Rs 29,700, then the price can decline to test the 200-day moving average support near Rs 28,500. But the probability of the price declining below Rs 29,700 immediately is very low.
Silver (Rs 46,741)
The MCX silver contract remains weak. Although the 200-day moving average support is close, at Rs 46,701, failure in the last two weeks to breach the resistance at Rs 49,000 denotes weakness. Prices can decline to Rs 45,500 in near future. Breach of Rs 45,500 can take the contract further lower to Rs 44,500. On the other hand, a bounce from Rs 46,701 can result in the metal testing the Rs 49,000 resistance once again.
The medium-term outlook is also bearish. The price can decline to Rs 41,500 over this time period. Key resistance is at Rs 53,000.
Copper (Rs 441)
The MCX copper contract continued consolidating between Rs 440 and Rs 460 for the sixth consecutive week. Within this range, the contract has dropped sharply last week to close near the lower end of this range. The bias is bearish. It can decline below Rs 440 and fall to Rs 425. Failure to breach Rs 440 can keep the contract in this range for some more time.
The medium-term outlook is bearish. Strong resistance is at Rs 470 and the price can decline to Rs 400-390. Only a strong rise above Rs 470 will turn the outlook positive.
Crude oil (Rs 5,903)
Last week, the MCX crude oil contract failed to extend its corrective rally beyond its resistance at Rs 6,100. The contract looks vulnerable to decline below its Rs 5,850 support targeting Rs 5,650 in the short-term. However, if the support at Rs 5,850 holds, then there is a possibility of a rally once again to Rs 6,100 or even Rs 6,230.
The medium-term outlook remains bearish as long as the contract trades below the Rs 6,600. A decline to Rs 5,400 is possible over this time period.
Natural gas (Rs 229)
The 200-day moving average support near Rs 223 has held very well last week. The MCX natural gas contract has bounced back from this support to close higher by a per cent for the week. For the short-term, the contract can continue to consolidate sideways between Rs 210 and Rs 240. Within this range, the contract can rise to Rs 235-240 in the coming week.
However, the medium-term outlook is bullish. The contract has been moving in a bull channel for more than a year. The channel support is near Rs 200 and a decline to this support will provide a good buying opportunity. The contract can target Rs 270 over this time period.

Excess supply to keep zinc price ranged.

Excess supply to keep zinc price ranged.
Zinc, the fourth most used metal, finds major use in the process of galvanising. Construction, transport and consumer goods are the major industries where zinc is used.

DEMAND, SUPPLY TO PICK UP

Global zinc production and consumption fell nearly 4 per cent and 2 per cent in 2012 respectively. However, the International Lead and Zinc Study Group (ILZSG) forecasts demand and supply to increase this year and next. The ILZSG projects demand to increase by 4.8 per cent and 5 per cent in 2013 and 2014 respectively. On the supply side, 1.7 per cent and 2 per cent is the increase it forecasts for 2013 and 2014 respectively.
Global zinc spot price has been moving in a broad range of $1,590 to $2,635 an ounce since 2010. This range has narrowed down to $1,750 to $2,200 an ounce in the last two years. Since 2008, the overall supply of zinc has always exceeded demand which has kept the price in a tight range. ILZSG forecasts this oversupply situation to continue in 2013 and 2014 as well. It expects supply to exceed demand by 1.20 lakh tonnes and 1.15 lakh tonnes in 2013 and 2014 respectively. As such, zinc price can continue to move sideways at least until 2014. However, Barclays, a global financial service provider, expects the zinc market to run into deficit in 2015 on weakening supplies from the mines.

TECHNICAL OUTLOOK

In this week’s dissector we see the outlook of the zinc futures contract traded on the Multi Commodity Exchange. The MCX futures contract closed at Rs 117.7, down 1.8 per cent for the week.
Long-term view: The long-term view is bullish for the MCX zinc contract. It has strong trend support near Rs 102 and below that the psychological support at Rs 100. These levels are likely to support prices in the long-term. Intermediate fall to these supports will be a good opportunity to enter long positions. A rise from the Rs 102-100 support zone can result in a rally to Rs 140 or even Rs 150. On the other hand, if the contract falls below Rs 100, then the decline can extend to Rs 96.
Medium-term view: The MCX zinc contract spiked to a high of Rs 136.9 and has come off sharply from there.
Significant resistance is at Rs 125.2.
The medium-term outlook would be bearish while the contract trades below this resistance.
The price can decline to Rs 110-108 over this time period.
The contract will need to rise strongly above Rs 125.2 to turn the outlook positive and take the price higher towards Rs 130.
Short-term view: The sharp fall from the August high of Rs 136.9 has taken support in Rs 116-115 region. However, the corrective rally from this support zone is finding resistance near Rs 120 now. A strong rise above this resistance is needed for the contract to rise higher towards Rs 125. Failure to breach the hurdle at Rs 120 can take the price lower to Rs 115 and can keep the price in a sideways range between Rs 115 and Rs 120 for some time.

Comex Gold To Test Resistance, Decline

Comex gold futures ended higher on Friday, underpinned by expectations that the nominee to lead the Federal Reserve Janet Yellen would continue easy monetary policy in that role. US regulatory filings for the third quarter showing that prominent Hedge fund Paulson & Co maintained its stake in SPDR Gold Trust, the world’s biggest gold-backed exchange-traded fund, also supported prices, after a surprisingly strong US labour-market reading re-ignited fears that the Federal Reserve would soon curtail bond purchases.
Outflows from the SPDR fund have amounted to more than 450 tonnes this year, driving its holdings to the lowest level since early 2009 at 865.71 tonnes. Gold prices have declined for much of 2013 amid fears the Fed would curtail its monthly bond purchases, removing a long-running source of support from the gold market.
Comex gold futures are moving in a narrow range. Charts are showing predominantly a bearish dominance.
As mentioned in the previous update, a fall below $1,315, is hinting that it might not rise as expected but could drift . The cyclical moves in the daily chart indicate that price could recover a little while staying above $1,275. The upside resistances are at $1,300 and could even extend till $1,315. Ideally this recovery should not exceed $1,315-20 in order to keep the price under the influence of bears for a later decline through $1,250. Unexpected recovery past $1,320 might hint at the possibility of strengthening further towards $1,355.
The wave counts need to be reviewed once again. A failed fifth wave move at $1,800 resulted in a corrective decline to $1,181 in the form of wave “A”. A possible wave “B” is in progress with targets near $1,420 or even higher to $1,485. This means a wave “C” is expected to follow through which could target $1,150 or even lower.
Alternatively, from the peak of $1,920 a corrective decline in the form of “A-B-C” is already over at $1,181 and a new impulse has begun. Confirmation of such an impulse will be seen at $1,535.
With the present move failing near $1,435-40, we will go with wave “B” ending at $1,433 and a possible Wave “C” underway with targets near $1,145-50 or even lower to $1,100.
RSI is in the neutral zone now indicating that it is neither oversold nor overbought. The averages in MACD have gone below the zero line of the indicator hinting at bearishness to be intact. Only a cross-over above the zero line could hint at bullishness again.
Therefore, look for gold futures to test the resistances and then decline .
Supports are at $1,275, 1,245 and 1,185. Resistances are at $1,300, 1,320 and 1,355.

Thursday, November 14, 2013

How Do I Make Money Investing In Start-ups ? By Zack Miller

How Do I Make Money Investing In Start-ups ? By Zack Miller
I wish investing in a startup was as easy as “buy low, sell high“, but it's a bit more complex.
Angel investors must consider a variety of factors when they put their capital to work in an early stage company like,
  • startup valuation: Figuring out how much a startup is worth is as much an art as it is a science.
  • choosing the right founders: Team plays a critical role in a startup's success. Investors want to invest in successful founders.
  • portfolio management: What's the right number of startups to hold in a portfolio? (Hint: Kauffman Foundation research says at least 6)
  • taxes: You gotta pay Uncle Sam at some point, right?
  • lots more… 
With all this in mind, a startup investor has to juggle lots of things at once — but ultimately, it's all about the money.

How do I make money investing in startups?

As OurCrowd and other equity crowdfunding startups democratize early stage investing, we get asked a lot about how investors make money in startups.
Basically, there are 3 ways a startup investor can make money:
  1. startup sells to another company: Large companies typically turn to startups to provide a shot of ingenuity with a side of technology for their existing businesses. So, at least in Israel, we see around 100 companies get bought every year by larger multinationals. For an investor in a startup, this is frequently the quickest way to make money on your original investment. When a startup gets bought out, an investor may receive cash or new stock (or a combination of the 2) from the acquiring company. So, how much an investor would see back on a merger or acquisition of this kind depends on his prorata share of the startup and the valuation the company was being acquired at.
  2. startup goes public: This happens less frequently than startup M&A because the qualifications to publicly float stock are typically higher and only more mature startups fulfill them. Of course in a world of global stock markets, investors in Israeli startups may see their investments IPO on the Tel Aviv Stock Exchange (TASE), the London Stock Exchange (AIM), or in the U.S. on the New York Stock Exchange (NYSE) or NASDAQ.
  3. startup gets big, pays dividends: Some companies decide not to get bought or IPO. Their founders have a vision of running large, standalone businesses. If they get there, they typically have lots of cash on their books and are generating more $$ every day. To repay investors, they can pay out part of their cash flow in the form of ongoing dividends or if the cash buildup on their balance sheet is large enough, they may decide to dividend out a chunk of that cash in a 1-time, special dividend. Conduit, a well-known Israeli internet technology company, decided to take this approach and paid back something like $300M to its investors.
  4. sell a share to someone else: Investors in startups typically have the ability to sell their shares to another buyer for a profit…if they can find one. Unlike many stocks that trade on stock markets, most markets for selling shares in startups are really illiquid. Most likely, if you were to check Sharespost or SecondMarket, the 2 leading markets for shares in private companies, you won't find an active market in shares of a specific startup (unless it's super hot and big — like Facebook was before it IPO'd). When investors ask me, I tell them they have to feel comfortable owning shares in their startup for a long time.
There are some other less common ways early stage investors get paid back. Sometimes investor will use convertible loans (like OurCrowd did when it funded Israeli flight technology company for the Operating Room, Surgical Theater) to fund deals. These are loans that can convert into equity at a later date.
Regardless, investors should pay close attention to how a startup is valued, who owns the equity and importantly, who owns rights to determine whether a startup can be sold. Inexperienced angel investors aren't always aware of these types of terms that can have a big impact on future investment returns. Fortunately, at OurCrowd, we negotiate these rights for our investors from the start.

Monday, November 11, 2013

What To Do When Things Don't Go Your Way

What To Do When Things Don't Go Your Way

Data for the week 09-Nov-13 to 15-Nov-13

Exp.: Expected or Anticipated value calculated from the recent survey conducted.
Prior: Represents the last actual for each indicator. In case there is a revision to the last actual, the prior column reflects the prior figure as revised.
Exp. change today: Exp. - Prior
Avg. change of last 1 year: Average Change in Actual data calculated for last 1 year.
Expected impact on price: This indicator shows the effect of the anticipation of data on the prices of related country’s major indices. We have categorized it as below:
Very Good Good Neutral Bad Very Bad
Actual: Refers to the actual/latest figures after its release.
Data for the week 09-Nov-13 to 15-Nov-13
Date Time (IST) Country Data Exp. Prior Exp. chg today Avg. chg of last 1 year Exp. Impact on Price
09-Nov-2013 02-00 AM United States Fed's Bernanke Speech          
09-Nov-2013 07-00 AM China Consumer Price Index (YoY) 3.3% 3.1% 0.20% 0.43 Neutral
09-Nov-2013 07-00 AM China Producer Price Index (YoY) -1.4% -1.3% -0.10% 0.61 Neutral
09-Nov-2013 11-00 AM China Industrial Production (YoY) 10.0% 10.2% -0.20% 0.67 Neutral
09-Nov-2013 11-00 AM China Retail Sales (YoY) 13.4% 13.3% 0.10% 0.78 Neutral
 
11- 15 Nov-2013 - India Imports YoY   -18.10%   7.12  
11-15 Nov-2013 - India Exports YoY   11.20%   4.12  
 
12-Nov-2013 03-00 PM United Kingdom Consumer Price Index (MoM) 0.3% 0.4% -0.10% 0.45 Neutral
12-Nov-2013 05-30 PM India Industrial Production YoY 3.5% 0.6% 2.90% 2.08 Good
 
13-Nov-2013 03-00 PM United Kingdom ILO Unemployment Rate (3M) 7.6% 7.7% -0.10% 0.07 Bad
13-Nov-2013 03-30 PM European Monetary Union Industrial Production w.d.a. (YoY) 0.00% -2.1% 2.10% 0.59 Neutral
13-Nov-2013 04-00 PM United Kingdom Bank of England Quarterly Inflation Report          
13-Nov-2013 08-30 PM United States U.S. Congressional Budget Talks Resume          
 
14-Nov-2013 05-30 AM United States Fed's Bernanke Speech          
14-Nov-2013 03-30 PM European Monetary Union Gross Domestic Product s.a. (QoQ) 0.1% 0.3% -0.20% 0.24 Neutral
14-Nov-2013 07-00 PM United States Trade Balance $-39.0B $-38.8B -0.20$ 3.21 Neutral
14-Nov-2013 07-30 PM European Monetary Union Euro-Area Finance Ministers Meet in Brussels          
14-Nov-2013 09-00 PM United States EIA Natural Gas Storage change   35B   24.64  
14-Nov-2013 09-30 PM United States EIA Crude Oil Stocks change   1.577M   3.45  
 
15-Nov-2013 12-00 PM India WPI Inflation 6.9% 6.46% 0.44% 0.38 Good
15-Nov-2013 13-30 PM European Monetary Union EU Finance Ministers Meet in Brussels          
15-Nov-2013 15-30 PM European Monetary Union Consumer Price Index (MoM) -0.1% 0.5% -0.60% 0.65 Neutral
15-Nov-2013 07-45 PM United States Industrial Production (MoM) 0.2% 0.6% -0.40% 0.97  
15-Nov-2013 08-00 PM European Monetary Union EU, U.S. NegotiatTrade Talks in Brussels