Showing posts with label COMMODITIES. Show all posts

Saturday, August 2, 2014

Rising Dollar Pushes Commodities Down While China Drives Industrial Metals Up

The US dollar rose 2.20% in July, primarily due to the Euro’s decline. A combination of weak economic news and falling Eurozone assets are having a negative impact on its common currency as well as European stocks. 
Dollar Etf_opt
US Dollar ETF rising in July
After a few months of flatness, the dollar made a big move, hitting a 6-month high. This surge had a negative impact on commodities. The CRB commodity index experienced a 5% decline in July, losing part of the ground gained this year.
CRB Commodities Index declining in July
A rising dollar has historically been bad for commodities and therefore this is also negative for industrial metals. However, industrial metals kept gaining ground this month thanks to stronger demand coming from China.
While global tensions (especially in Europe) made developed markets struggle, emerging markets had a very good month. Chinese stocks rose 10% in July, breaking out to the highest level in three years. The good news for China is very good for industrial metals as China is the biggest user of these commodities.
China iShares (FXI) hitting 3-year high
What This Means For Metal Buyers 
Industrial metals performed well in July thanks to positive news from China. However, commodities lost some ground to a rising dollar. A stronger dollar could have a depressing effect on industrial metal prices. The performance of industrial metals through the rest of the year will strongly depend on these two factors.
Source : Agmetalminer.com

The Best And Worst Performing Assets In July 2014 And YTD

Up until the last day of July, everything was going great: stocks were solidly up for the month, the DJIA was on the verge of 17,000, and the wealth effect was flourishing, if not the economy. Then yesterday happened, and everything changed: not only did the S&P turn red for the month, but the DJIA slid to red for 2014. So what is the best performing asset class in July? With the PBOC now openly unleashing QE in its economy, no surprise that it was the Shanghai Composite, which returned over 8%, if virtually nothing since 2009. However, don't expect this to last: for China real estate is orders of magnitude more important than the stock market to boost the wealth effect.
As for the best returning assets class in 2014 YTD: don't laugh - it's still Spain and Italy. Expect the day of reckoning for Europe's periphery to be fast, unexpected and very brutal.
From Deutsche Bank:
The last 48 hours have made a big difference to returns in July with a sell-off in rates, credit, equities and commodities changing the month dramatically over this period and leaving a few more markets down for 2014 now.

DM equities were tipped into negative territory for July while EM stocks had enough outperformance through the rest of the month to largely stay in positive territory despite the weakness in Russian equity markets. China was the key outperformer with the Shanghai Composite (+8.8%) posting its best monthly total return performance since December 2012. The rally in China also benefitted Hong Kong equities with the Hang Seng (+7.3%) recording its biggest monthly gain in two and a half years. Back to the DM world, the Stoxx 600 and S&P 500 were -1.6% and -1.4% respectively – with the former probably negative impacted by the BES-driven weakness in Portugal (-10.5%).

A poor month for the DAX (-4.3%) and CAC (-4.0%) has pushed them both into negative total return territory for the year at -1.5% and -1.2%, respectively. The FTSE was down -0.1% on the month keeping it in slightly negative territory for the year (-0.3%) although dividends have helped YTD total returns stay in the green. The DOW is also down YTD now.

Moving on to Fixed Income, it was a mixed month for core rates with Europe outperforming Treasuries. This is perhaps not surprising with core European rates flirting around their all time lows whilst USTs suffered a dip following the strong GDP print just a day before month end thus giving up about half of all of the month's earlier strong gains. Turning to Credit, it was modest month for IG total returns but nevertheless IG still did better than HY with US HY (-1.7%) underperforming on the ETF outflow story. Staying in fixed income but moving to EM, the overall benchmark was down 0.6% with strength in Asia (+1.3%) neutralising the weakness in Latam (-0.7%) and EEMEA (-1.3%).

The commodity complex had a very weak month with Corn, Wheat, and Brent all down -16%, -6%, and -5% respectively. Incidentally this also came during a fairly encouraging month for the Dollar bulls with the Greenback appreciating about 2% against a basket of major currencies.

To sum up the year to date performance so far, the European peripheral complex is still the key winner with the IBEX (+12%), FTSEMIB (+11%), Spanish Bonds (+10%) and BTPs (+10%) topping our performance ranking chart and returning about twice as much as the S&P 500 (+6%). EM equities have also done surprisingly well this year with a +8% gain to date. The latest July performance in China has also bumped both the Shanghai Composite (+7%) and the Hang Seng (+9%) into our top 10 list. Core DM rates are still in positive territory, though not surprisingly with Bunds (+6%) outpacing Treasuries (+3%). On the other end of the spectrum, the Nikkei (-3%) remains a key laggard while Russia (-5%) is feeling the heat from the ongoing geopolitical volatility. Generally commodities are amongst the worst performers this year largely led by softs.
Visually, the month of July
The Best And Worst Performing Assets In July 2014 And YTD

And YTD:
The Best And Worst Performing Assets In July 2014 And YTD

Friday, July 18, 2014

Goldman Forecasts Lower Commodity Prices as Cycle Ends

Goldman Forecasts Lower Commodity Prices as Cycle Ends
Commodities from iron ore to copper and Brent crude will drop over the next five years as global supplies climb, according to Goldman Sachs Group Inc., which highlighted oil’s recent losses as a sign of increased output.
There will be substantial declines in some metals, energy and bulk commodities, analysts including Chief Currency Strategist Robin Brooks wrote in a report. The period of continued year-on-year price rises for most commodities is over, they said in the report, which was dated yesterday.
Banks from Citigroup Inc. to Deutsche Bank AG have called an end to the commodities super-cycle, when China’s surging demand combined with supply constraints to more than double prices in the 12 years through 2010. Raw materials rallied this year from three annual losses as a lack of rain in Brazil lifted coffee and a ban of ore exports from Indonesia spurred a rally in nickel. The drop in energy prices since last month showed the impact of higher global output, Goldman said in the report.
“A prolonged period of elevated commodity prices has catalysed a supply response,” the analysts wrote. “We do not expect a collapse in global commodity prices. But we do anticipate substantial declines.”
Copper was forecast to drop to $6,600 a metric ton over five years, while iron ore was seen at $80 a ton and Brent may be $100 a barrel, according to Goldman. The steel-making raw material was at $98 a dry ton in Tianjin, China, today, and copper traded at $7,123 on the London Metal Exchange today. Brent was 33 cents higher at $106.35 on the ICE Futures Europe.

‘Looser Supply’

The Bloomberg Commodity Index of 22 raw materials climbed 3.4 percent this year. That compares with a 0.9 percent drop in the Bloomberg Dollar Spot Index and 5.3 percent advance in the MSCI All-Country World Index of equities.
“Against a looser supply backdrop, commodity prices should be much less sensitive to fluctuations in global growth than they were,” Goldman said in the report, entitled “Emerging Market Forex and the End of the Commodity Market Super-Cycle.”
Goldman said in a January report the cycle that spurred higher commodities prices is reversing as increased U.S. shale oil output keeps energy prices low, and that would eventually drive raw materials into a bear market. The new cycle would be the opposite of the super-cycle, it said then.
U.S. production of crude, along with liquids separated from natural gas, surpassed all other countries this year with daily output exceeding 11 million barrels in the first quarter, Bank of America Corp. said in a report July 4. Output climbed as hydraulic fracturing and horizontal drilling help producers to pull record volumes of crude out of shale formations.

Oil Supplies

Brent rallied to as much as $115.71 a barrel last month as military gains in Iraq by an al-Qaeda breakaway group stoked concern that oil supplies from the region may be disrupted. Prices posted a third weekly loss in the period to July 11, with Iraqi shipments unaffected and Libya moving to boost exports.
“Less than a month has passed since geopolitical risks in Iraq pushed up oil prices on concerns over a potential oil supply shock, and the market seems to have absorbed the related risks reasonably well,” Goldman’s analysts wrote. “The expansion in oil supply over the past few years -- primarily from the expansion of U.S. shale production -- has minimized the consequences from past disruptions in Libya and Iraq.”
Iron ore entered a bear market in March on prospects for a glut as supplies surged. Rio Tinto Group (RIO), the world’s second-largest mining company, said today iron ore production in the three months to June gained 11 percent, while Fortescue Metals Group Ltd. said its shipments were 57 percent higher on year.

Surplus Market

“We remain bearish on iron ore, and expect a surplus market to drive the longer-term price down,” the Goldman analysts wrote in yesterday’s report. “We see limited upside for agricultural commodities over the longer run.”
Deutsche Bank said last month commodity prices will remain subdued for years as many of the factors and fears that drove the super-cycle have dissipated. Citigroup said in April 2013 that death bells would ring for the commodity super-cycle.
“Our long-term commodity forecasts suggest that fundamentals for commodity currencies will deteriorate,” the Goldman analysts wrote. “Relative shifts in terms of trade between commodity importers and exporters will be a key input to currency determination over the coming years.”

Tuesday, July 8, 2014

Peru's Gold, Copper, Zinc output decline during May; Silver up 7.5% y/y

Peru's Gold, Copper, Zinc output decline during May; Silver up 7.5% y/y
Peru gold, copper zinc and tin production declined sharply year-on-year during May this year while its Silver output advanced by nearly 7.5% from a year earlier, as per latest government data.
Gold and Silver Production
Gold production declined sharply by 24.6% to 10,629 kg from 14,091 kg a year ago on falling production at mines operated by Newmont (-40%) and Barrick (-31%). Production has also fallen due to a government crackdown on illegal gold miners in the Amazon jungle.
Silver production advanced sharply by 7.4% year-on-year to 332,629 kg as Buenaventura (+24%) increased production.
Minerals account for about 60% of Peru's total exports. Peru is also the world's second-biggest silver producer and fifth biggest producer of gold.
Copper, Zinc ad Tin Production
Nation's copper production dipped by 2.1% to 106,946 mt from 109,278 mt a year earlier as declines at Antamina (-27%) and Freeport's Cerro Verde mine (-11.2%) offset gains at Glencore's Antapaccay operation (+17%) and Southern Copper (+12.4%).
Zinc production fell 6.6% to 112,528 mt due to a drop in output at Antamina and mine closures by Buenaventura and San Ignacio de Morococha, while lead gained 3.1% to 23,575 mt on gains at Votorantim Metais unit Milpo and the startup of Trevali Mining's Santander mine, according to the ministry.

Minsur, the country's only tin producer, increased production 4% to 1,892 mt, while molybdenum rose 0.8% to 1,208 mt as Southern Copper increased output. Cadmium production at Votorantim Metais' Cajamarquilla refinery gained 16.3% to 67 mt and tungsten rose 64% to 7 mt.

Friday, July 4, 2014

Why Google’s Skybox buy is worrying commodity investors

Why Google’s Skybox buy is worrying commodity investors
The data that it provides can result in unfair advantage to those with deeper pockets

In buying the US firm cheap, Google has earned the wrath of commodity investors, particularly those who do not have deeper pockets.
The reason: they fear that Skybox’s satellite technology could result in the manipulation of the commodities market.

What’s so special?


What’s special about Skybox’s satellite technology? It plans to put a constellation of 15 satellites about 300 km above earth in two years’ time to take pictures of any part of the globe twice a day. In five years, the firm will have 24 satellites covering the breadth and width of the earth and will capture real-time videos of things, for example, a vehicle speeding through a highway.

The satellites will capture images of high resolution meant for commercial purposes. Currently, there are only nine satellites that can deliver images with such resolution but they are being utilised by the US security agencies for defence purposes.

The finer details


The advantage with such high resolution is that it can provide minute details of production, be it coal, iron ore or crude oil. For example, it can provide images of oil tankers that can tell us the pace of production by a particular country. The images can tell us the speed of an oil tanker movement by sea, giving indications of whether it will reach on time or be delayed.

Images from agricultural fields can provide details of how planting is progressing or what a crop’s health is.

Skybox currently has subscribers, including investors, for its data which include satellite imagery of oil shipments, pipeline activities and storage site.
According to the Wall Street Journal, an analyst at UBS has said that if he can buy satellite images of parking lots at Wal-Mart stores, he can project the company’s sales figures before the quarterly earnings report are announced.
Similarly, measurement of density of trucks outside Foxconn in Taiwan can let us know when the next iPhone is due.

Skybox can turn out to be the next in-thing that can have an impact across a spectrum of industries, starting from equities and commodities to corporate intelligence.

Experts point out to global positioning system (GPS) as an example for the Skybox’s potential. Initially, GPS was seen as a tool for defence purpose. Today, it has found varied uses, including movement of people and traffic.
Similarly, Skybox could lead to numerous apps and services, which, experts feel, no one can even think of now.

Skybox, according to its website, has plans to provide data and other services along with Google. It says it will revolutionise access to information. All these point to the potential for providing service at a fee.

Investors worried
These prospects have left many investors and market players worried. Last week, a US consumer protection body, Public Citizen, asked the US regulators to review the acquisition of Skybox. It said that the satellite technology could help manipulate commodity markets.

The watchdog said that satellite images of oil, gas and power infrastructure is already helping deep-pocketed firms such as banks and hedge funds gain advantage in trading intelligence.

Though other firms provide such data to traders, Google is seen gaining an unfair advantage through its huge customer base.

Public Citizen contends that Skybox’s technology could exacerbate the unfair advantage that already exists for bigger players in markets. Google and Skybox haven’t commented yet anything on this charge.

Besides this, charges of invasion of privacy have also been raised against Skybox. Along with the potential and Google’s scope to gain from a cheap buy, the unfolding scenario will be worth watching.
Why Google’s Skybox buy is worrying commodity investors

Australia losing 75,000 mining jobs in next two years

Between 50,000 and 75,000 mining jobs will be lost in Australia over the next couple of years as the industry's US$427 billion (A$450bn) investment on new capacity slows, research by the ANZ bank released on Wednesday shows.
According to the bank, the cuts will occur because the sector is switching from the job-heavy construction stage to the operational phase, which requires fewer workers.
Falling commodity prices, with both iron ore and coal tumbling this year, will also affect job creation and could see more positions go
Falling commodity prices, with both iron ore and coal tumbling this year, will also affect job creation and could see more positions go due to mining companies and suppliers efforts to cut operational costs.
Earlier this year Glencore (LON:GLEN) shut part of its Ravensworth coal mine because the operation was uneconomical. Brazil’s Vale (NYSE:VALE) followed closing its Integra Mine Complex for the same reasons. And they’re not alone, cut backs are going on throughout the whole sector.
This ANZ chart shows the strong relationship between resources investment and job creation. Taking into account resources extraction, which is increasingly becoming a volume game, resources investment, and commodity prices, the estimates are alarming.
Australia losing 75,000 mining jobs in next two years
By 2016 the bank expects resources investment (the blue line) to drop from about 7.5% of GDP to 4% — almost half in nearly three years. The yellow line, which shows employment related to resource investment, implies it will follow the blue line.
As a result, the bank's economists say there will be little improvement in the nation's 5.8% jobless rate.
ANZ senior economist corporate and commercial, Justin Fabo, was quoted by The Australian saying that weaker than expected commodity prices would likely increase the risks to more job losses as mining firms seek to cut costs.
"So we think the unemployment rate will be in spitting distance of six percent over the next 12 months, and for improvement after that to be gradual," he said.
The Australian Workforce and Productivity Agency estimates there are 263,000 jobs in the resources industry, which represented an 80% increase over five years.

Wednesday, July 2, 2014

The Best And Worst Performing Assets In Q2 And The First Half Of 2014

Here are the best and worst performing assets broken down by the three key time periods as we leave the first half of 2014 (it's not been a good year for wheat).
June
  • Best: Silver
  • Worst: Wheat
Q2
  • Best: Russia's MICEX stock market
  • Worst: Wheat
First Half
  • Best: Italy's FTSE-MIB stock market and Spain's IBEX - thanks Draghi TLTRO
  • Worst: Wheat
Some additional commentary from Deutsche Bank:
In YTD terms, of the main indices we track the FTSE-MIB (+14.5%) and the IBEX (+12.8%) have been the star performers. Spanish, Portuguese and Italian bonds have not been far behind. Interestingly commodities make up quite a few of the other top ten places (with the CRB index, Gold, Silver and Oil returning between 7-11%), but also 2 of the worst 3 with Wheat and Copper both down more than 6%. Also negative was Chinese equities (-1.5%) after disappointing growth in H1 which may explain some part of the weakness for certain commodities. The Nikkei (-6.1%) was the only other asset lower YTD in our sample. Apart from these four all the other assets saw a positive 2014 total return. Credit has put in a good performance in 2014 so far with most major indices returning between 4-7% which is impressive in the low yield, low spread environment.
Source: Deutsche Bank

Monday, June 2, 2014

The Best And Worst Performing Assets In May

If April was supposed to be the best month of the year only to leave everyone scarred, bruised and battered, another confirmation that in the Fed's New Normal all the folksy old aphorisms no longer work came with the last trading day in May when we learned that the old adage of "sell in May and go away" has not yet paid off with broad gains for most asset classes in the past month. Equities, Rates, Credit and EM were all generally stronger. Commodities delivered the key underperformance largely led by a sell-off in softs and precious metals.
And while the best performer in May was by far the Russian stock market (which may have crushed Jay Carney's hopes for a macro hedge fund career in his post-White House life), the highlight has certainly been the global rally in DM rates. Indeed the global rally saw nearly all (except for Denmark, Iceland and Greece) the 10-year yields of developed government bond markets finish the month lower.
The Best And Worst Performing Assets In May

Other observations on the past month's performance from Deutsche:
The strong performance in US rates has definitely provided a boost to EM and spread products across the world. This has trumped good or bad data/fundamentals as the driver of assets in the last few weeks. Having said that, a strong election outcome in India and some emergence of stability in the Russia/Ukraine stand-off were also helpful for EM sentiment. EM bonds were up nearly 2.5% in May bringing their YTD gains to 5%.

Away from EM fixed income, DM spread products also did well with positive total returns seen across IG and HY indices on both sides of the Atlantic. Given the performance in rates, IG has generally outperformed HY but much of this is due to the longer duration of IG indices. It’s worth noting that European and US IG/HY credit benchmarks have yet to have a negative month so far this year.

Turning to equities, the MSCI EM equity index added 3.5% in May. The ongoing market chatter around Chinese stimulus has also helped sentiment in the Hang Seng (+5.4%), which posted its best gains in 8 months. Staying in the region, Japan’s Nikkei (+2.3% in May) also enjoyed its best month this year although the index is still down 9.4% YTD. Away from Asian equities, the S&P 500, the DAX, and the Stoxx600 all recorded their best performance since February although overall European markets (especially the peripherals) are still outperforming their American counterparts so far this year.

Soft commodities were the worst performers in May largely driven by an improving supply outlook for grains. Wheat (-12%) posted its worst monthly drop since 2011 as better rainfall across the Great Plains in the US has apparently improved crop conditions. Away from softs, WTI Oil (+3.0%) and Copper (+3.1%) have been doing better though with the latter posting its best monthly performance this year on talks of Chinese stimulus. Let’s see if we see further momentum on the back of the better-than-expected Chinese manufacturing PMI print that was released over the weekend!
Looking at returns YTD:
YTD gains (including dividends) for the Stoxx600 and the S&P 500 are 7% and 5% respectively. These performances are being overshadowed by gains in Portugal, Ireland, Italy and Spain which are up by +13%, +9%, +16% and +11%, respectively this year.  Overall it has been a pretty good ride for Fixed Income so far this year, across both rates and credit, with total returns in DM credit ranging between as low as 3.3% (USD Fin Senior) to as high as +7.9% (Spanish bonds).
And visually:
The Best And Worst Performing Assets In May

Thursday, May 22, 2014

China Imports and Exports of Base Metals in April 2014

 On May 21, China Customs released imports and exports of refined copper, primary aluminum, and other base metals in April 2014 (unit: mt):
 
 Apr.YoY (%)Jan.– Apr.YoY (%)
Imports:
Refined Copper341,40686.541,342,54156.12
Primary Aluminum35,199150.90188,435218.04
Unwrought Nickel (Refined Nickel+Nickel Alloy)16,31910.0854,510-14.36
Refined Lead8-95.3589-79.69
refined zinc64,76344.22262,26239.03
zinc alloy8,855-20.7332,217-11.07
Refined Tin + Tin Alloy491-62.312,510-62.63
Exports:
Refined Copper21,499-25.0277,055-49.99
Primary Aluminum10,9853.3234,497-5.15
Refined Lead3,45131.8610,79581.14
refined zinc2232,240.67649-44.36
Unwrought Nickel (Refined Nickel+Nickel Alloy)8,571226.6819,87398.20
Refined Tin + Tin Alloy--100.00292-63.58

Sunday, May 18, 2014

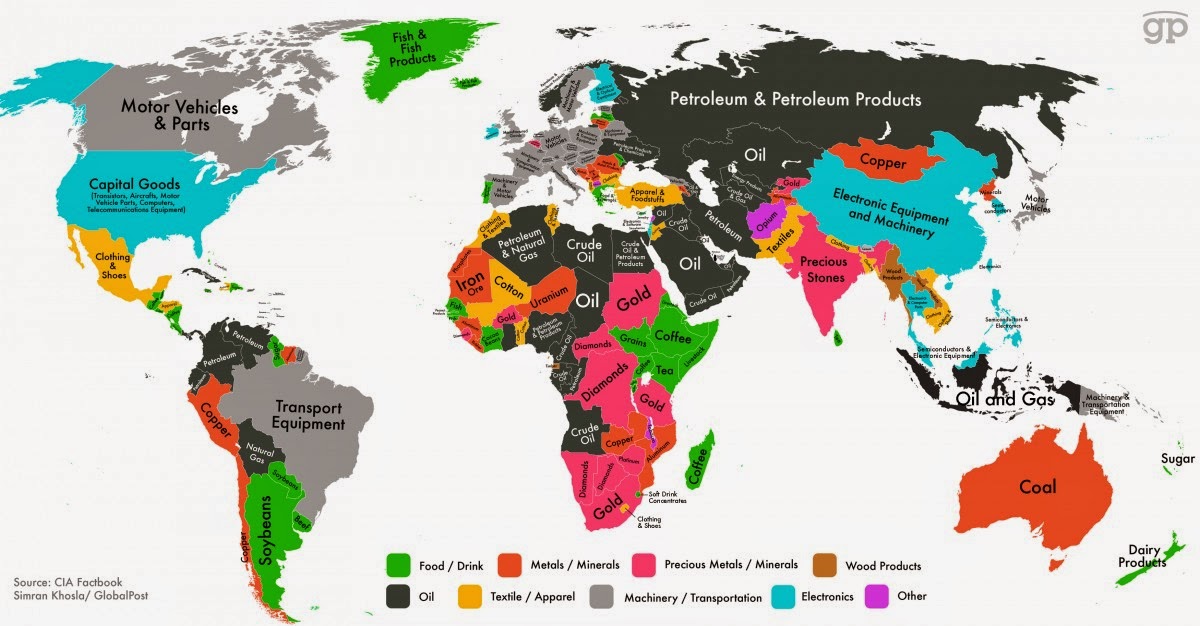
World Commodities Exports Map

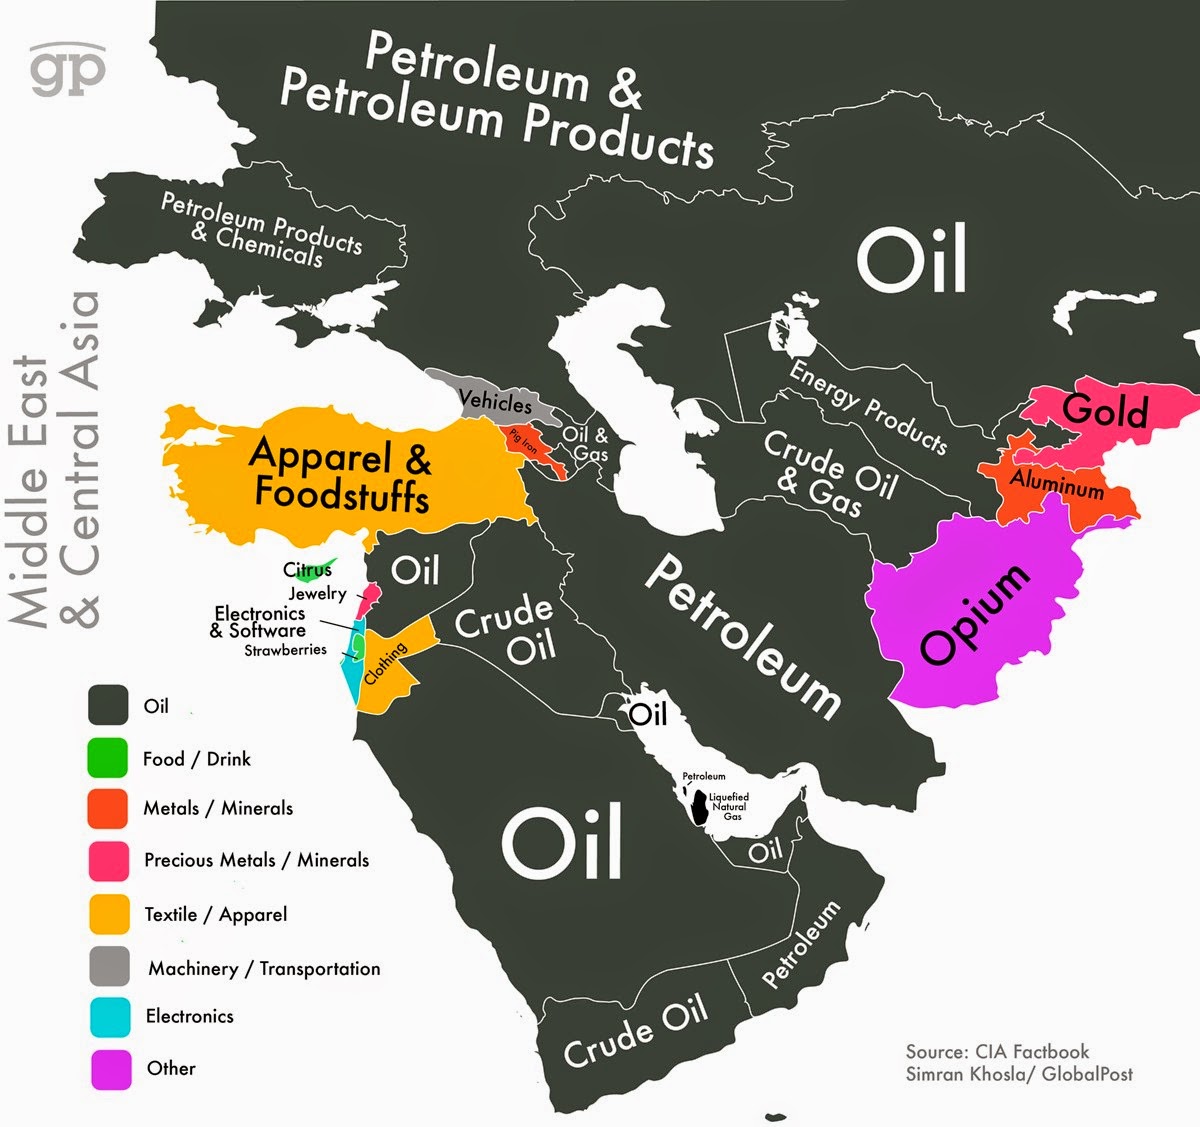
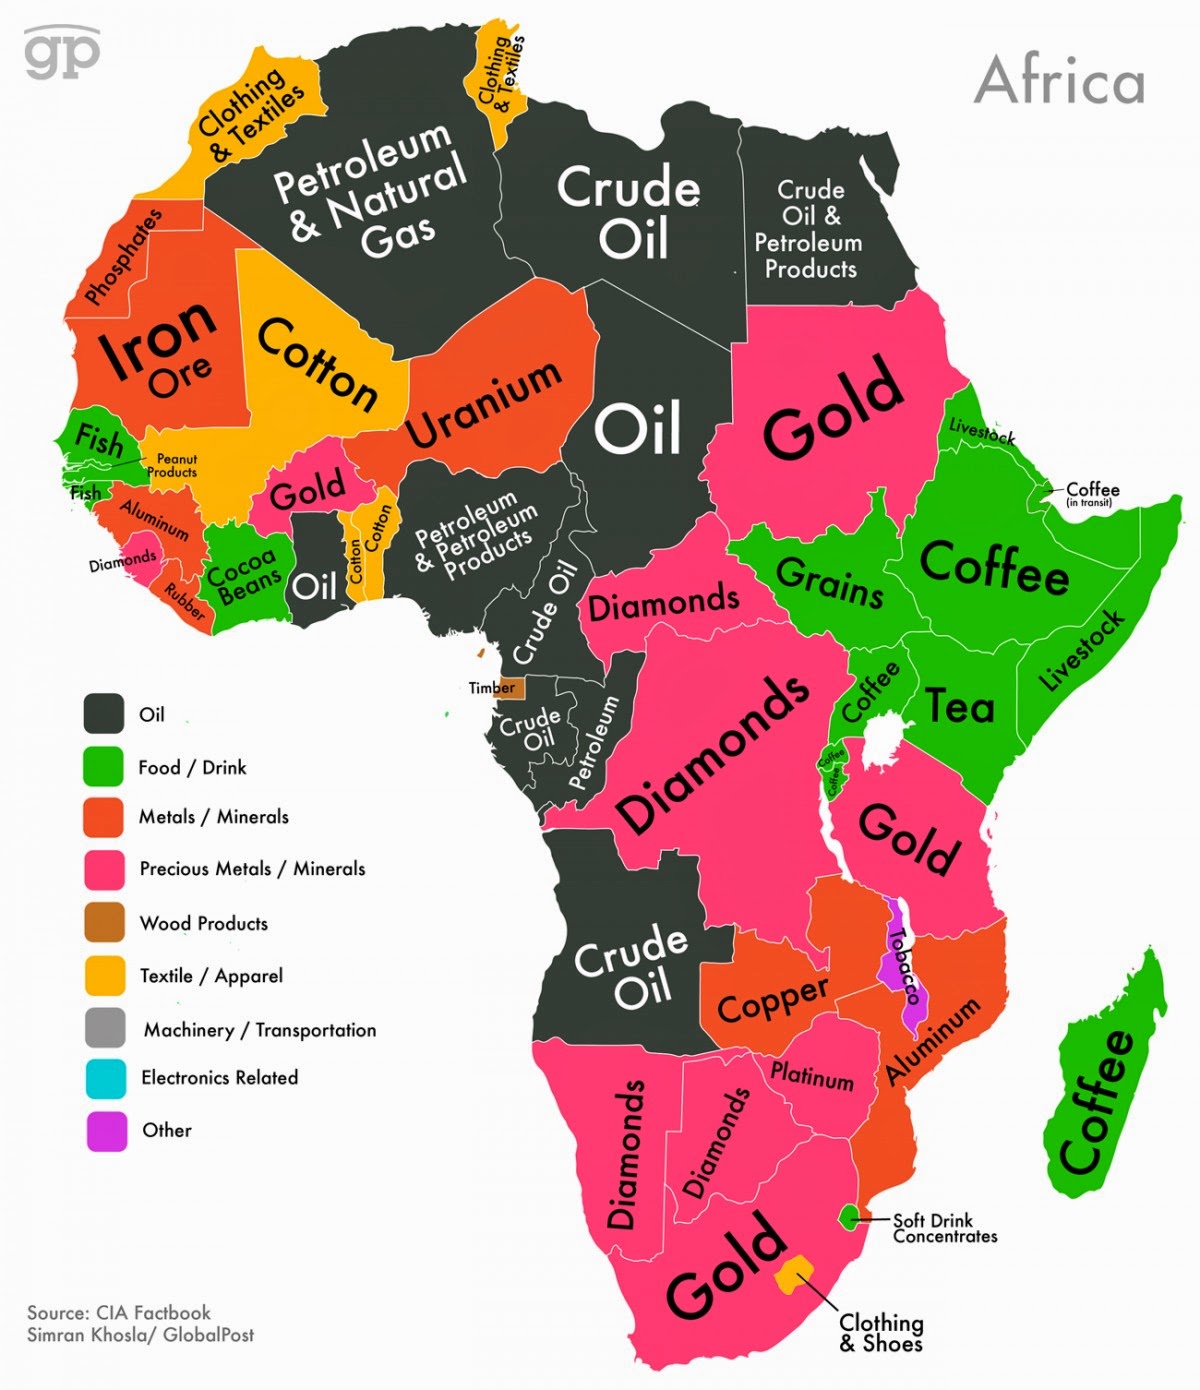
Using data from the CIA Factbook, we labeled every country in the world by its highest valued export, a.k.a. the commodity that makes the country the most money in the global market. Click on any of the maps below to see an enlarged version. 

Unsurprisingly, much of the world runs on oil, particularly the Middle East and Central AsiaEurope is the world's workshop, where most of the machinery and motor vehicles are made, from optical instruments to BMWs. Latin America brings a blend of food products and oil to the trading table. Asia is the world's manufacturing center, where the world's clothing, wood products, and semiconductors are made. Africa is extremely rich in natural resources, particularly precious metals and oil. Australia makes the most money from coal.  A substantial part of the continent makes its money on diamonds, gold or oil. Source globalpost.com by Simran Khosla

Every Country's Highest-Valued Export In Map World


Every Country's Highest-Valued Export In Map Europe

Every Country's Highest-Valued Export In Map mid east central asia
Every Country's Highest-Valued Export In Map north americaEvery Country's Highest-Valued Export In Map central america
Every Country's Highest-Valued Export In Map south america


Every Country's Highest-Valued Export In Map asiaEvery Country's Highest-Valued Export In Map africa

Friday, May 16, 2014

Goldman Sachs remains bearish on Gold, Silver and Copper

Goldman Sachs remains bearish on Gold, Silver and Copper
Goldman Sachs reiterated its bearish view on gold and copper Wednesday, but raised its forecasts for a host of other base metals, saying improved US economic activity will weigh on gold, although the Ukrainian conflict may delay the move of weaker gold prices.
“While we remain bearish on gold, escalating geopolitical tensions in Ukraine have offset stronger U.S. macro data,” Goldman said.
The firm said it continues to see gold prices by year-end at $1,050 an ounce. The silver-price forecast remains at $17.50 an ounce.
For copper, Goldman lowered its three-month, near-term forecast to $6,600 a metric ton from its previous forecast of $7,000 because of Chinese property-sector weakness; however, the firm also raised its 12-month forecast to $6,600 a ton from $6,200. It is keeping its year-end 2014 copper forecast at $6,200 a ton.

Saturday, May 10, 2014

Barclays - China's April Commodity Imports Still Strong

Barclays - China's April Commodity Imports Still StrongChinese import data for April suggest still-resilient domestic demand and likely corporate stocking of raw materials on low commodity prices, said Barclays Research.
According to Barclays, Chinese crude oil and copper saw double-digit import gains in value terms, while the volume of iron ore imports also saw double-digit rises, although value rose only 2.1%.
Automobile imports also maintained strong growth, rising by 33% in April. Overall, Barclays thinks the data support their view of a modest quarter-on-quarter growth recovery in the second quarter.

Thursday, May 1, 2014

Best And Worst Performing Assets In April And 2014

As we noted on the last day of March, April was supposed to be the best month for stocks, with an average return since 1950 of over 2%. It wasn't.
In fact it barely managed to eek out a positive return, treading negative MTD performance until the last few days.
Still, nothing compares to the rout of the laughable Greek stock market, which after generating scorching returns in the first quarter, tumbled in April by nearly 8%, and cut its YTD gains by more than half. In fact, Greece, with its stock market where a few oddlots can move the market by more than 1%, performed worse than even Russia's stock market - the same Russia which none other than the White House speaker Jay Carney told everyone to short. Curiously, while there were no sanctions announced against Japan, the Nikkei was in danger of losing almost as much as Russian stocks in the past month.
But it wasn't all doom: among the better performers were the FTSE, the Bovespa, and a bevy of commodities such as Corn, Wheat and the broader CRB Index. Here is some additional color from Deutsche Bank:
April was a generally positive month across the board for global financial assets, although with a handful of major losers. No single asset class stood out although equities and commodities had a relatively strong month with the top performers including UK (FTSE 100, +3.1% - helped by M&A), Brazilian (Bovespa, +2.4%) and Spanish (IBEX 35, +1.6%) Equity and Corn (+2.4%), Wheat (+2.3%) and the broader Commodity index (CRB, +1.6%). YTD commodities have performed strongly with Corn (+22% YTD) and Wheat (+18% YTD) the two best performing assets and the broad CRB commodity index returning +10.5%. The rest of the 2014-so-far top 5 is made up by Peripheral European Equities with the FTSE-MIB and Portugal General returning +15% and +14% respectively.

Fixed income performance sat in the middle of the pack in April with EU Fin Sub bonds continuing to lead the way returning +1.4% on the month and +5% YTD. Other strong performers in fixed income this month were Italian and Spanish government bonds and US IG Non Fin and US Fin Sub all returning around +1% on the month. This stronger performance marks a continuation of trends seen through 2014 so far with returns on Spanish govvies at +7.1% YTD, BTP’s at +6.5% YTD and US IG Non-Fin and Fin Sub of around +4.5% YTD.

Sterling continued to perform in April with GBPUSD returning +1.3% this past month. GBPUSD returns now stand at +1.6% on the year, only being beaten in  the G7 FX space by JPYUSD at +2.6%. GBPUSD’s been on a bull run since early June last year and is now around its post-2008 highs.

April has seen a few notable losers with the Greek Athex down -7.8%, the Russian Micex down -4.6% and the Nikkei down -3.5%. The weak Micex and Nikkei are continuing themes this year, now returning -13.1% and -11.5% respectively. Geopolitical risks and sanctions are continuing to weigh on Russia with fatigue impacting the Japan reflation trade. April’s weak Athex performance on the other hand marks a sharp divergence from 2014 performance pre-April as the index has given back much of it’s strong performance YTD. When we last wrote this performance review at the end of March YTD Athex performance was +15%, after April it now stands at +6%. However it is up +28%% over the past 12 months.
The full April performance by asset class:
Best And Worst Performing Assets In April And 2014

A different pictures emerges in the YTD chart,where corn, wheat and Italy are the best performers, while Russia, Japan, Copper, Hong Kong and China round out the tail end.
Best And Worst Performing Assets In April And 2014

Jim Reid's conclusion: "So now April's over, will it be sell in May and go away? Or buy in May and make hay.. We just made that one up. We don't expect it to catch on!"

Tuesday, April 22, 2014

What Hedge Funds Are Buying And Selling

Large speculators reduced ther S&P 500 positioning to net short this week and their NASDAQ longs to a one-year low as BofAML reports on CFTC data. Macros funds decreased their long exposure to S&P500 and NASDAQ to now hold short exposure. They also decreased their long exposure to US Dollar (raising their AUD longs to a record high) and maintained their long exposure to 10-year Treasuries. They decreased their long exposure to commodities and increased their long exposure to EM. Across all asset classes, positioning is at extremes.
Significant HF moves across asset classes, based on CFTC data
Equities. Large specs decreased S&P 500 to net short and reduced NASDAQ longs. They also increased Russell 2000 shorts last week

What Hedge Funds Are Buying And Selling CFTC Data
Agriculture. Large specs increased their long positioning in Soybean futures but decreased longs in Corn and Wheat futures
What Hedge Funds Are Buying And Selling CFTC Data
Metals. Large specs decrease Gold and Silver longs and increased Copper shorts. They maintained Platinum and Palladium longs.
What Hedge Funds Are Buying And Selling CFTC Data
Energy. Large specs increased their Crude longs and Gasoline longs. They also increased Natural Gas shorts but Heating Oil shorts.
What Hedge Funds Are Buying And Selling CFTC Data
FX. Large specs increased their EUR, AUD and GBP longs. They decreased their JPY shorts and MXN longs position.
What Hedge Funds Are Buying And Selling CFTC Data
Interest Rates. Large specs increased their short positions in 10-year while increasing their long position in 30-yr. They also reduced 2-year shorts
What Hedge Funds Are Buying And Selling CFTC Data

One can't help but see this positioning and wonder just who the big boys are selling to - as we noted here,
Based on Bloomberg's Smart Money Flow indicator, there is a very significant amount of distribution going on... the question is just who is soaking up the smart money selling? Company buybacks, Johnny 5, or a greater-fool retail investor?

What Hedge Funds Are Buying And Selling CFTC Data

Perhaps this chart from Lance Roberts at STA Wealth provides some color for who?
What Hedge Funds Are Buying And Selling CFTC Data

However, the idea that individual investors are still "out of the market" should be taken with a bit of caution. The chart below is data compiled by the American Association of Individual Investors (AAII) which surveys it membership on portfolio allocation.  The data is compiled and released monthly. 


What Hedge Funds Are Buying And Selling CFTC Data

With cash hovering at the lowest levels since the "Tech Wreck," and equity exposure at the highest,investors are more than just "warming up" to equities. They are effectively "all in" with respect to the financial markets.