Showing posts with label BULLION = Gold & Silver. Show all posts

Wednesday, February 24, 2016

Gold and the 34-Month Moving Average

Gold gave up $8.70 last week (after the previous week's gain of $81.30/oz.) to close at 1,230 and printed a bearish harami candlestick on the weekly chart. Friday's close was on resistance at 1,230. Look for support at 1,190.

A breakout from the 34-month exponential moving average (chart) would be very bullish. Assuming a breakout, our price target is 1,370.

Cycles
A 4yr cycle low is due in the first half of 2016 possibly as early as Feb/March but It looks increasingly as if it may have arrived last December. Wait for a breakout from the 34-month moving average to make that decision. Weekly cycles point to a high in late March.

Gold and the 34-Month Moving Average

Tuesday, February 16, 2016

Lack of Asian buyers may keep a lid on gold price

Lack of Asian buyers may keep a lid on gold price

The surge in the gold price last week has not resulted in increased buying of the precious metal by the world's two biggest gold clients: China and India.
According to the Times of India, buyers have so far shown little interest in hitching their wagons to the gold rally.
On Thursday, the price of gold climbed nearly $70 an ounce as turmoil on world financial markets and global economic fears sparked a return to safe-haven buying.
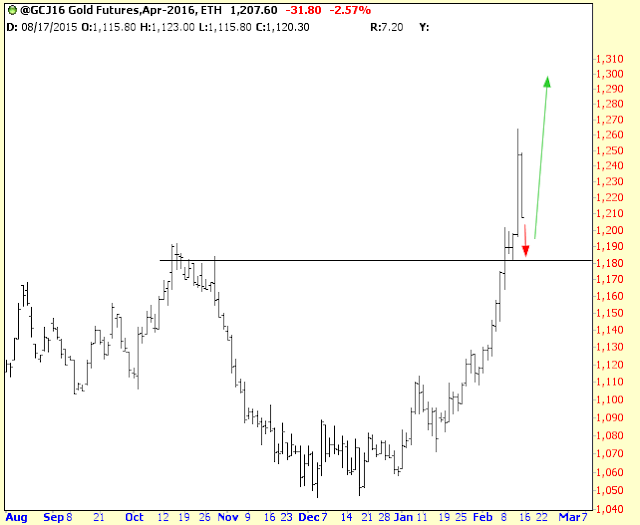
Futures contracts in New York with April delivery dates jumped 5.8% to a high of $1,263.90 an ounce in massive volumes of nearly three times usual volumes. That moved gold into a bull market with gains topping 20% from the near six-year low struck mid-December. However by Friday, some of the rally had diminished, with gold futures slipping $7.10 to $1.240.60 an ounce.
While Australia's Perth Mint had one investor order a million dollars worth of gold, it noted most of the interest is from Western clients. That is perhaps surprising given that Indian and Chinese buyers often swoop in to buy gold bars, coins and jewelry if they are confident of a sustained rally. On the contrary, despite offering a record discount of $40 to the global benchmark price, retail demand has "almost vanished" Times of India quotes one Mumbai-based jeweller. Discounts were also being offered in Japan, Hong Kong and Singapore.
Between them, China and India account for around 45 percent of world gold demand.
Meanwhile Dennis Gartman of The Gartman Letter was quoted on CNBC on Friday as saying that it might be a good idea to wait on gold.
Gartman told CNBC's Squawk Box that gold is likely to correct before the Presidents' Day holiday on Monday, on the back of rising U.S. equities, and could slide to between $1,215 and $1,225, at which point he might buy in.

=================================================

Lack of Asian buyers may keep a lid on gold price
Support $ 1183 or $ 1191.70 last top in October 2015. Next Target $ 1308. 

Sunday, February 14, 2016

Why Most Investors Hate Gold

The move in gold, up 17% year to date, is important, according to ConvergEx's Nick Colas...

Why Most Investors Hate Gold

We’ll be blunt: most financial asset investors really hate gold.

Anything – even leaving money in the bank – is better than owning gold since at least society has access to your capital through the banking system.  Once you buy physical gold, no one has access to that sliver of your portfolio.

Of course, that’s actually a feature for the owner since physical gold is no one else’s liability. 

So the notable rally in gold is essentially a protest vote against the global financial system, the equivalent of taking your ball and going home.

This only happens when investors think central banks have lost their way, and that’s not good news.  Think of gold as a super-duty dive watch.  It can go places humans can’t actually even dive.  The watch will outlive the person wearing it.  Kind of cool, but you don’t necessarily want to test it yourself.
Finally, Colas adds...There are three reliable signs of a market bottom, where things get so bad it is safe to step in.
First, when the S&P 500 drops 5% or more in one day.

Second, when the CBOE VIX Index tops 40.

And third, when everything sells off for a few days and correlations for all equities approaches one.

None of these events have yet occurred.
And so we wait...

Gold Technically To Move Higher, $1550 A "Possibility" - BoA Merrill Lynch

As investors continue to flock to gold, pushing prices to highs last seen one year ago, one major U.S. bank says it may also be jumping on the bandwagon.
Technical strategist for Bank of America Merrill Lynch, Paul Ciana, told Kitco News that the bank went long gold at the $1,089 level as the metal formed a “rounded bottom pattern” earlier in the year.
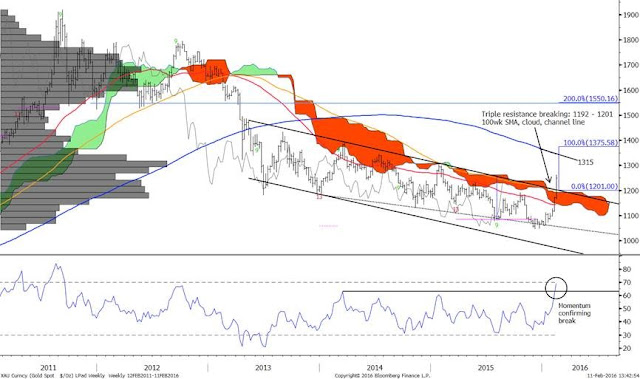
Now that the yellow metal has breached the $1,201 level, things are starting to look even more positive, he added.
Gold Technically To Move Higher, $1550 A "Possibility" - BoA Merrill Lynch

Thursday, prices rallied to levels last seen 12-months ago, with gold pushing back above $1,260 an ounce. Gold futures are up over 18% on the year, with April Comex gold settling the day up $53.20 at $1,247.80 an ounce.
“Given the fact that price action has been able to break up through resistance of $1,201, we’ve extrapolated the 200-week average to estimate an outside target of $1,315,” he said. “Our measured move projection based on the height of the channel, estimates a second target of $1,375,” he added
Ciana noted that gold may even have the “possibility” to move over $100 from there.
“We’re not making this a target but looking back at the trend over the last 5 years, there’s a large gap in the price distribution of which sometimes these gaps get filled,” he explained. “That may lead gold prices to $1,550.”
Looking at support levels, Ciana said that the under-$1,000 price tag that pundits were calling for earlier in the year ago may not be as probable given the recent upswing in gold prices.  
“Sub-$1,000 was definitely a possibility 2-3 months ago, but I do not really see that as likely at this point,” he said.
By Sarah Benali of Kitco News

Tuesday, February 9, 2016

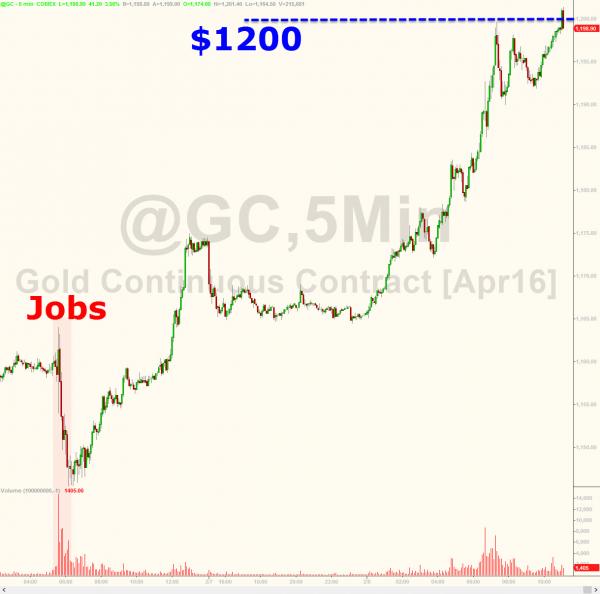
Gold tops $1200 for the first time since June 2015...

Since The Fed policy-error'd in December, gold is now up 22% over US equities...
Gold tops $1200 for the first time since June 2015...
Gold tops $1200 for the first ime since June 2015...

Tuesday, February 2, 2016

Gold price jumps to 3 month high

Gold price jumps to 3 month high
Hedge funds positioning themselves for further upside

With weakness returning to equities and crude oil on Monday, gold futures trading in New York attracted brisk buying from investors eager for alternatives amid all the market turmoil.
In afternoon trade gold for delivery in April, the most active contract, was exchanging hands for $1,129.30 an ounce, up $12 or more than 1% compared to Friday's close and at its its highs for the day.
Thanks to safe haven buying gold’s trading at a 3-month high and is now up 7.5% since hitting a near six-year low mid-December.
Across 24 commodity futures markets money managers entered a net long position for the first time in five weeks
Large futures speculators or "managed money" investors such as hedge funds dramatically raised bearish bets on gold during the final months of 2015. Net short positioning – bets that gold could be bought back at a lower price in the future – hit a record 2.4 million ounces during the final trading week of 2015.
This year however hedge funds have been non-stop buyers pushing overall positioning firmly back in the black. According to the CFTC's weekly Commitment of Traders data released on Friday speculators added to long positions – bets that prices will rise – and trimmed short positions, leading to a more than 10-fold increase in net longs.
Speculators also added 55% to net silver long positions while copper bulls came roaring back trimming overall short position by a third. Platinum longs were increased and shorts cut, but bullish palladium bets declined from the previous week. Both PGMs remain in small net long positions.
Across 24 commodity futures markets money managers reduced bearish bets, entering a net long position for the first time in five weeks according to data by Saxo Bank.
Better sentiment towards crude oil was the most notable feature of as bullish bets increased by 34% – the biggest percentage jump since 2010. Traders may be regretting the shift with US benchmark crude oil prices plummeting 6.2% to $31.50 a barrel on Monday.
At the start of the year, across all commodity futures net short positions increased to 112,000 lots, the highest since government records began in 2009.

Friday, October 30, 2015

Gold price on knife edge after post-Fed fall

Gold price on knife edge after post-Fed fall

Spooked by Federal Reserve's hawkish stance, hedge funds start liquidating 345 tonnes worth of bullish gold futures positions
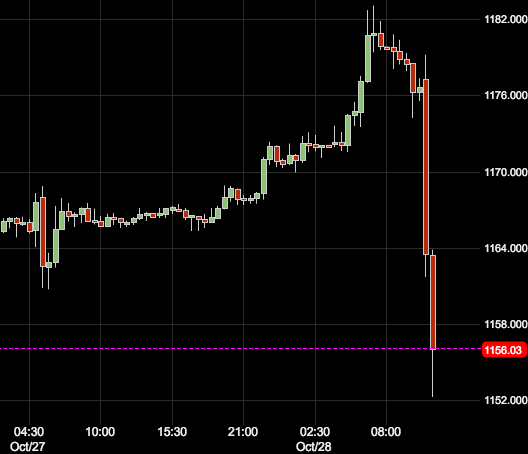
Yesterday on the Comex market in New York, gold futures with December delivery dates fell more than $30 an ounce from where it trading just before the Federal Reserve's interest rate announcement. By the end of the day gold had clawed back some of those losses, but on Thursday the metal was being sold off again.
Late afternoon Thursday gold was exchanging hands for $1,145.10 – down more than 3% from $1,183.50 ahead of the Fed statement and a three week low. Higher interest rates boost the value of the dollar and makes gold less attractive as an investment because the metal is not yield-producing.
While the Fed decided to keep interest rates unchanged it changed the language in the statement to suggest a hike in December is more likely. The market had begun to price in an increase only in March 2016 and gold bulls were forced into a retreat.
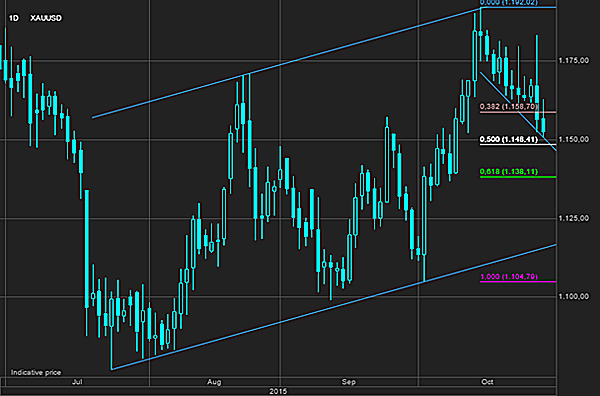
Failure to hold this level would attract some additional long liquidation as a break below $1,140 could signal a reversal of sentiment
The Fed voted 9 to 1 to leave rates in a range of zero and 0.25% where they have been since December 2008. Interest rates in the world's largest economy has not been raised in more than nine years which played a huge factor in gold's rise to a record $1,909 in September 2011.

Gold hit its highest level since June 22 a fortnight ago, amid fresh indications that a limp US economy may push a rate hike further into the future, but that narrative now seems to no longer apply.
On the technical front gold is also looking vulnerable.
Hedge funds reduced bullish bets to more than five year lows ahead of the September Fed decision, but the hold on rates then forced a change of thinking with large futures speculators or "managed money" playing catch-up as the sentiment towards gold turned.
Hedge funds built up net long positions – bets that gold will be more expensive in future – for five weeks in a row, tripling holdings over the past month.
Last week the  CFTC's weekly Commitment of Traders data showed net longs now stand at 12.2 million ounces (345 tonnes), the highest since February.
That constituted a huge reversal from July and early August when hedge funds entered net short positions for the first time since at least 2006, when the Commodity Futures Trading Commission first began tracking the data.
Ole Hansen, head of commodity strategy at Danish bank Saxo says after yesterday's abrupt reversal the price of gold has so far managed to stay above the next level of support at $1,148 an ounce (only just), but "failure to hold this level would attract some additional long liquidation as a break below $1,140 an ounce could signal a reversal of sentiment":
Gold price on knife edge after post-Fed fall

Monday, October 12, 2015

Gold price just $15 away from major rally

On Friday, gold bulls were off to the races, spurred by a turnaround in sentiment towards commodity markets and fresh indications that a rise in US interest rates may be further off than previously thought.
On the Comex market in New York, gold futures with December delivery dates traded up as much 1.3% at $1,159.30, the highest since August 21. Gold is up 5% from where it was trading before the US Federal Reserve at its September meeting decided to hold rates steady. The last time rates were hiked was June 2006.
The week before hedge funds more than doubled net longs which now stand at just under 5 million ounces, the highest since April
Gold's leg up on Friday came after Fed minutes released yesterday suggested that the US economy will grow well below historical averages for the rest of the decade. The central bank estimates growth of around 1.7% through 2020 versus average growth of 3.1% over the past 50 years.

The dollar and gold, and bond yields and gold, have strong negative correlations and on Friday the greenback fell against the currencies of its major trading partners while treasury yields fell across the board.
Hedge funds were wrong-footed by the decision to keep interest rates near zero reducing bullish bets to more than five year lows ahead of the Fed decision.
But sentiment has now turned and according to the CFTC's weekly Commitment of Traders datafor the week to October 6 large speculators on Comex – referred to as "managed money" – added nearly a fifth to their bullish positions from the week before.
The week before hedge funds more than doubled net longs which now stand at just under 5 million ounces, the highest since April. Speculators also cut back on short positions – bets that gold could be bought cheaper in the future – reducing overall positions to 7 million ounces, down from record highs above 11 million ounces set in July.
We have argued that the first US rate hike could become a buying opportunity as it would remove the uncertainty that has prevailed for many months
In late July and early August, hedge funds entered bearish positions not seen since at least 2006, when the Commodity Futures Trading Commission first began tracking the data.

Saxo Bank in its quarterly outlook released last week, said the "the eventual recovery in gold hinges on a change in sentiment among paper investors".
The Danish bank pointed out that most of the third-quarter rallies were driven by hedge funds covering short positions, first after the Chinese devaluation and second after the dovish Federal Open Market Committee statement on September 17. Friday's rally, in solid volumes, followed a similar pattern:
"The combination of a dovish Fed, uncertainty about China’s currency policy and the health of the global economy, as well as low investor involvement, may eventually be what triggers or forces a sentiment change. We have argued that the first US rate hike could become a buying opportunity as it would remove the uncertainty that has prevailed for many months. As we still wait for what potentially could be an elusive rate hike, some uncertainty will linger.
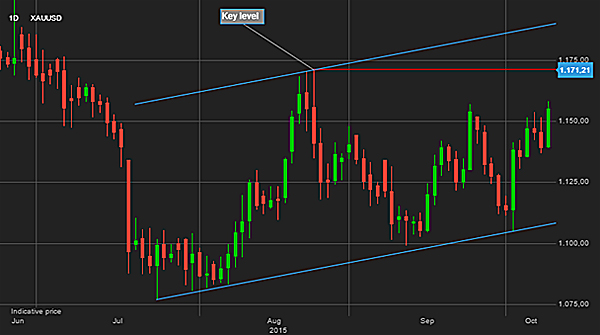
"But having seen three robust recoveries within a short period, we sense a change of sentiment is unfolding. Key to this would be a move above gold’s August high at $1,170/oz, which would confirm a floor has been established. We maintain our year-end target of $1,250/oz and only a break below $1,080/oz would bring a change to this outlook."
Click here for Saxo Bank's commodity insights and essential trades for the final quarter of the year.
Gold price just $15 away from major rally

Monday, August 10, 2015

Is The "Smart Money" Ready To Bet On Gold?

For the last three weeks, gold has experienced something that has never happened before -hedge funds aggregate net position has been short for the first time in history.
Is The "Smart Money" Ready To Bet On Gold?

However, as Dana Lyons notes, this week saw another 'historic' shift in gold positioning as commercial hedgers shifted to the least hedged since 2001... so the 'fast' money is chasing momentum and the 'smart' money is lifting hedges into them.
It’s no secret that commodities have taken a drubbing during the deflationary spiral over the past year. And precious metals have been right up front in this beating. This includes gold, which has lost over 40% of its value the past 4 years.  So needless to say, there has not been much good news on that front. However, as we touched on in a piece two weeks ago, there are signs beginning to pop up that may provide a glimmer of hope for gold bugs. In dollar terms, the price of gold continues to leak, offering very little evidence of any impending stability or bounce. On the other hand, in Euro terms, gold prices reached a key juncturea few weeks ago, as outlined in that previous post. And while no bounce has materialized as of yet, gold has at least held at the level we noted.
Today’s Chart Of The Day offers another hopeful data point for gold bulls. The CFTC tracks the net positioning of various groups of traders in the futures market in a report called the Commitment Of Traders (COT). One such group is called Commercial Hedgers. As their name implies, their main function in the futures market is to hedge. And while the Non-Commercial Speculators tend to be trend-following funds, the Commercial Hedgers’ postions tend to move contrary to price trends. Thus, it is almost always the case that these Hedgers will be correctly positioned – and to an extreme – at major turning points in a market.
How is that relevant for gold? As of this week, Commercial Hedgers are holding the lowest net short position in gold futures since the launch of the gold bull market in 2001.

Is The "Smart Money" Ready To Bet On Gold?

Does this mean that a reversal higher is imminent in gold? Not necessarily. The thing with COT analysis is that it is difficult to correctly determine when an “extreme” in Hedgers’ positioning will actually result in a price reversal. As is said regarding all sorts of market metrics, an extreme in COT positioning can always get more extreme. Plus, the COT positioning can peak well in advance of the turn. Consider the Hedgers’ maximum net short positioning in gold futures which occurred in December 2009, 21 months – and another 50% gold rally – before prices topped.
Thus, it is tough to time trades with accuracy based on the COT report. However, one thing we can say in the gold bugs’ favor: what had mostly been a headwind for gold for the past decade or so is no longer the case. While it may not make an immediate impact, the “smart money” Commercial Hedgers are now more aligned with them than at any point since the bull market began in 2001.
More from Dana Lyons, JLFMI and My401kPro.

Sunday, August 9, 2015

The all-inclusive cost to produce gold is about $ 1,100

The all-inclusive cost to produce gold is about $1,100
“Gold’s father is dirt, yet it regards itself as noble” So goes a Yiddish proverb. Trouble is, it has not lived up to the proverb’s meaning: gold, like other commodities, has taken a beating over the past month.
Unlike many commodities, it has few industrial uses. A big chunk of demand is for investment. Gold held in exchange traded funds — a typical investment instrument — has fallen 40 per cent since a 2012 peak.
The recent gold price fall means more trouble ahead for gold miners. The all-inclusive cost to produce gold is about $1,100. If gold prices fall below $1,000, some gold reserves (assets) would be unprofitable to recover and need to be written down, putting pressure on the more indebted miners.
Gold cannot fall forever. Even so, listed gold miners should at some point be cheap. One early buy signal is when it costs less to buy mines on the stock market than to build them. Building a gold mine from scratch can be measured, crudely, by the cost of the investment (including debt) an ounce of gold produced. An average new mine would cost $2,500 an ounce of annual output, estimates RBC. Yet the larger listed gold miners still have an average enterprise value to production of $3,600.
More traditional valuation metrics tell a similar story. Despite the precious metal’s fall, the two largest miners by market value, Barrick Gold and Newmont Mining, still trade at double their forward price earnings multiples of two years ago.
Even if gold prices keep falling, it is far too early to sift the dirt for glitter.

Thursday, July 30, 2015

Gold to dip below $1,000 by end of the year – report

Gold to dip below $1,000 by end of the year – report
Gold is doomed. That’s the message we are clearly getting these days from several analysts who predict prices for the metal have, at least, another 30% to fall by the end of 2015.
According to the latest Bloomberg survey of analysts and traders, bullion prices will hit $984 — the lowest price for the precious metal since 2009 — before the year-end.
Speculators are shorting the metal for the first time since US government data began in 2006, and holders of exchange-traded products are selling at the fastest pace in two years”
Speculators are shorting the metal for the first time since US government data began in 2006, and holders of exchange-traded products are selling at the fastest pace in two years”, according to the report.
Analysts from Deutsche Bank predict a much greater decline than that.
"Gold would need to fall towards $750/oz to bring prices in real terms back towards long-run historical averages," they said Tuesday.
Prices for the precious metal have hit  five-year lows on expectations that the US Fed was going to hike interest rates for the first time in almost 10 years. As gold doesn’t pay income it benefited from the historic period of near-zero interest rates. Betting Fed officials were in favour of an increase, many decided to unload their gold holdings.
August gold was down $6.30, or 0.6%, at $1,089.90 an ounce in late morning trading the New York Comex after trading as high as $1,098.50 earlier. Prices were set to mark their sixth straight settlement under $1,100.
However the Federal Reserve on Wednesday both declined to rate interest rates and provide any clues about when a hike is on the way.

Sunday, July 26, 2015

India cuts tariff value on imported gold

India cuts tariff value on imported gold
The Indian Government today announced cut in import tariff value for gold and silver . The import tariff value of gold was slashed by nearly 6%, in accordance with prices of precious metals in the international market. Meantime, tariff value on imported silver has been left unchanged.
The Central Board of Excise and Customs (CBEC) issued notification in this regard reducing the gold import tariff value to $354 per 10 grams. The import tariffs are being slashed from the existing $376 per 10 grams. Meanwhile the import tariff value of Silver has been kept unchanged at $498 per kilogram.
The government move to lower the import tariff value is in primarily on account of weakening gold prices in the global and domestic markets. The possibilities of US Fed raising rates by September this year have also hit the sentiments badly for gold.
Meanwhile, gold prices edged lower on Singapore session today, on the back of rising dollar strength and higher US interest rate hopes. The prices slipped to five-year low level of $1,084.80 per Oz. Many brokerages have downgraded their earlier forecasts on gold prices. For instance, Macquarie has cut its gold price forecasts by 7% to 15% from this year through 2019, signaling a possible long term down-trend for the yellow metal. The investment firm has cut its gold price estimate for the current year to $1,152 per Oz from the earlier $1,249 per Oz.
The gold in India declined almost Rs 320 per 10 grams to Rs 25,050 per 10 grams on declining demand from retail buyers. Industrial demand for gold also remained weak. Silver too witnessed significant fall on lack of demand. The prices dropped by Rs 380 per kg to touch Rs 33,950 per kg.
Tariff value is the base price on which the customs duty on imported gold or silver is calculated and it further helps prevent under-invoicing.

Tuesday, July 21, 2015

Gold crash isn’t over — prices near five-year lows

Gold crash isn’t over — prices near five-year lows
Gold prices continued its downward spiral Tuesday trading close to their lowest level in five years amid rising expectations the U.S. Federal Reserve will hike interest rates later this year.
The precious metal dipped down the $1,100 an ounce-mark in early Asia hours, but came back up above that level on bargain hunting.
Prices were just modestly lower in early U.S. trading Tuesday, changing hands at $1,105.10 an ounce at 9:15 am ET.
On Monday, prices dropped down to $1,080.00 an ounce, the lowest since March 2010, causing a stock blood bath among gold miners.
Brokers and market analysts are speculating that at least one major fund took advantage of the thin market to push the gold price through a support level on the charts
Brokers and market analysts are speculating that at least one major fund took advantage of the thin market to push the gold price through a support level on the charts, possibly because they had already sold gold short.
They said the sudden collapse bore similarities to “bear raids” by Chinese funds in copper in January, which drove red metal prices down to a six-year low.
“There is to my mind no coincidence that this happened in the quietest, thinnest period of the week,” David Govett, head of precious metals at Marex Spectron in London, told Financial Times.
“Anyone who trades gold knows not to put any volume into the market at this time, unless they deliberately want to move it in a big way,” Govett added.
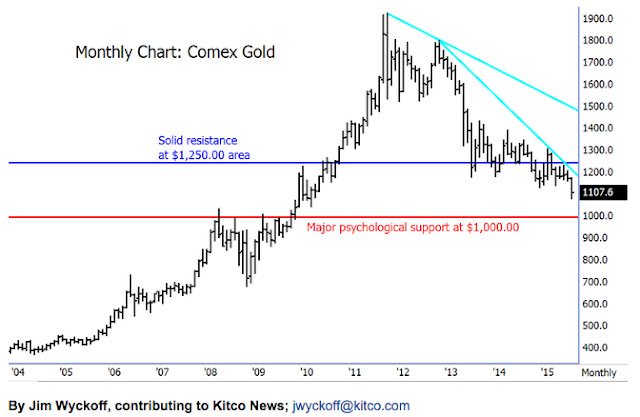
Kitco’s analyst Jim Wyckoff says that a sustained drop below the $1,100 mark “would then open the door to still lower prices, with an ultimate downside objective being the 2008 low of $681.00.” And he illustrates his point with the following chart.
Monday's price dip dragged gold companies stocks down to historical lows:
  • Barrick Gold (NYSE:ABX, TSE:ABX), the world's top producer of the metal, sank 16% to $9.58 (Canadian) in the Toronto Exchange, the lowest price in 26 years.
  • Goldcorp (NYSE:GG)(TSE:G), the world’s biggest gold miner by market value, and Eldorado Gold (TSE:ELD) (NYSE:EGO) both hit their lowest in a decade.
  • Kinross Gold (TSE:K) (NYSE:KGC) declined to $2.21, its weakest level since 2001.
  • Newmont Mining (NYSE:NEM), another large gold producers, fell 11.4% to around $18.33, the lowest in seven months. It was the biggest loser on the S&P 500.
Gold prices have been steadily falling since a peak of $1,900 an ounce in September 2011.

Thursday, June 11, 2015

Peru's metal output rises in April, silver production lags

Peru's metal output rises in April, silver production lags
The production of almost all major metals by Peru reported robust growth in Peru during the month of April this year. While the output of copper, gold and zinc reported significant increase during the month, silver production declined, in accordance with the official government data released yesterday.
According to data released by the Energy and Mines Ministry, copper production rose 18.5% from 103,410 mt in April last year to 122,506 mt in Apr ’15. The decline in copper output from Freeport-McMoRan's Cerro Verde was offset by increased mine output from Antamina, Southern Copper, Toromocho and Antapaccay mines.
The increased output from Newmont and Barrick gold mines contributed to the 15% growth in gold production during April this year. The gold production totaled 379,504 Oz in Apr ’15, in comparison with the output of 330,273 Oz during the same month a year before.
Silver production dropped marginally by 0.4% over the year from 9.57 MOz to 9.53 MOz in April. The output from Antamina mines dropped significantly, whereas Buenaventura and Volcan reported rise in silver production during the month.
Zinc production rose 17.7% from 97,128 mt a year before to 114,323 mt in Apr ’15. Lead output too rose 27% from 97,128 mt to 114,323 mt over the previous year. Lead output witnessed sharp increase in Antamina, Volcan and Milpo. Molybdenum output too jumped 45% to 1,632 mt in April 2015.
Meantime, tin production by Minsur- the country’s only tin producer, rebounded sharply in April this year, rising nearly 15% from 1,438 mt in April 2014 to 1,654 mt in April this year.

Wednesday, June 10, 2015

How central banks will push up the gold price

Gold on Tuesday was inching its way back to the $1,200 an ounce, a level it hasn't strayed too far from for the better part of three months.
A new research note by anlyst Simona Gambarini of Capital Economics suggests official sector buying can take much of the credit for establishing something of a price floor for the metal this year.
During the first quarter this year, the World Gold Council estimates that 120 tonnes of gold were added to global central bank reserves.
Central banks have upped their share of overall gold demand from around 2% in 2010 to as much as 14% last year and in 2013.
Just to up gold as a share of forex reserves to 5% central banks in emerging economies need to buy 8,000 tonnes
Gambarini expects this trend to strengthen adding that "any emerging market central bank looking to reduce exposure to the dollar still has few credible alternatives to gold":
Most developing countries still hold less than 10% of their reserves in gold, compared to 70% or more in advanced economies. Admittedly, the much higher share in the latter is mainly a legacy of the Gold Standard. Nonetheless, an optimal share that makes the most of gold’s diversification benefits would probably be at least 15%. Even the European Central Bank (ECB), established long after the demise of the Gold Standard, holds around 25% of its reserves in gold.
Barron's quotes chief economist Warren Hogan and commodity strategist Victor Thianpiriya of ANZ, an Antipodean bank, on the same issue:
"If all central banks in the world were to hold at least 5% of their foreign exchange reserves as gold, this would require the purchase of almost 8,000 tonnes of gold,” argued Hogan and Thianpiriya. Emerging market central banks should remain net buyers of gold to bring their allocations more in line with developed countries’ – to the tune of about 75 tonnes a year, they added.
How central banks will push up the gold priceWhile Russia's central bank has been most active recently (30 tonnes in March and another 8.3 tonnes in April), rumours about massive buying from People's Bank of China are perennial.
China's gold reserves are officially put at 1,054 tonnes – a number authorities haven't updated since 2009.
Gold makes up only around 1% of the country's $3.8 trillion in reserves compared to more than 70% for the United States which holds more than 8,000 tonnes of gold in vaults.
ANZ expects the gold price to top $2,000 an ounce by the end of the decade while Capital Economics has a $1,400 forecast for the end of this year.

Tuesday, June 2, 2015

Dollar knocks gold price back below $1,200

Dollar knocks gold price back below $1,200
Large scale speculators in gold futures sharply reduced bets on a rising price as the metal is once again rebuffed at the $1,200 an ounce level.
On Monday gold for delivery in August – the most active futures contract – raced out of the gate to reach a day high of $1,205 only to fall back just below Friday's closing price at $1,189.20
Gold has been hovering either side of $1,200 for the best part of three months, but has not been able to break higher, stymied by a strong dollar.
The greenback was trending higher on Monday with the US dollar index reaching a month high against major world currencies.
The dollar is up 21% in value over the past year and is trading near 12-year highs against the yen and multi-year highs against the euro. The euro and the dollar usually move in opposite directions.
As gold retreated further from 3-month highs hit mid-May large investors on the gold futures like hedge funds or so-called "managed money" last week slashed their bullish positions.
In the week to May 26 according to the Commodity Futures Trading Commission's weekly Commitment of Traders data, hedge funds added to short positions – bets that prices are declining – and at the same time slashed their long positions.
On a net basis hedge funds are now long 7.3 million ounces down 16% from last week, nearly 10 million ounces below levels hit in January this year, but still well off the 3.1 million ounces position held mid-March.

Thursday, May 7, 2015

Global silver output running low — Report

After over ten years of gains, global silver production is expected to drop this year, as new supply from projects won’t be sufficient to replace production losses from aging operations, a study released Wednesday shows.
According to the World Silver Survey 2015, published by The Silver Institute and Thomson Reuters GFMS, global silver output went up by 5% in 2014 to reach 877.5 million ounces, the 12th successive gain and a new record. This year, however mine supply is set to decrease.
“We’re just not seeing the investment in new mine capacity that would be needed to sustain continued record peak production,” Andrew Leyland, an analyst with GFMS who worked on the report, told The Street.
Global silver output running low — Report

Weak silver prices are to blame, the report says. The precious metal lost 20% of its value last year, closing at $15.70, and dropped 36% in 2013, exceeding the losses in gold and other precious metals. In the year through Tuesday silver prices have recovered by 6.2%, but they are still close to the five-year low of $15.365 an ounce set in March.
About 70% of the global silver supply is produced while mining other metals, especially gold, copper, lead and zinc. Weak prices for these commodities are also likely to weigh on silver supply going forward, the report adds.
Global silver output running low — Report
India to take the lead
India’s demand for jewellery surged by 47% to 62.2 million ounces, and it is set to outrank China as the world’s largest consumer, where jewellery fabrication dropped 26% to 46.7 million ounces.
“Despite the Chinese economy growing at a reported 7.4% in 2014, the true impact on the ground failed to reflect this robust performance,” the report says.
“Consumers were less inclined to spend as a result, with gold, silver, and platinum jewellery all recording annual declines as sentiment became cautious,” it adds.
The outlook for the year is rather lukewarm. The report concludes that while silver prices will see some short-term weakness, they are likely to end 2015 at more than $17 an ounce, with a couple of years of modest price increases to follow.

Thursday, April 16, 2015

CHARTS: What will happen to gold price after Greek exit

New study shows Greek bond yields as proxy for euro-zone break-up risk is more reliable than the strength of the US dollar in predicting the gold price

The real possibility of a Grexit is back on the cards. And with it a resurgent gold price.
New York gold futures moved back above the $1,200 an ounce level on Wednesday on news that Greece is preparing to declare a debt default by the end of April amid stalled negotiations with its international creditors.
A report by the Financial Times On Monday said Greece will withhold $2.7 billion in May and June repayments to the International Monetary Fund because it's running out of money to pay state salaries and pensions:
A Greek default would represent an unprecedented shock to Europe’s 16-year-old monetary union only five years after Greece received a €245bn bailout
“We have come to the end of the road . . . If the Europeans won’t release bailout cash, there is no alternative [to a default],” one government official said.
A Greek default would represent an unprecedented shock to Europe’s 16-year-old monetary union only five years after Greece received the first of two EU-IMF bailouts that amounted to a combined €262bn.
Default is a prospect for which other European governments, irritated at what they see as the unprofessional negotiating tactics and confrontational rhetoric of the Greek government, have also begun to make contingency plans.
On Wednesday a report by the Wall Street Journal said negotiations between Greece and its creditors "are nowhere near resolution" for bailout money to disbursed and quotes a US Treasury official:
“It’s important that a strategy be found in which Greece can continue to honor their obligations,” the U.S. official said. “If that doesn’t happen, if there’s not an agreement on that, then there would be economic, potentially tough economic challenges, for Greece,” he warned.
“It would also enhance and amplify uncertainties for Europe and for the global economy. So it’s of great importance that an agreement be reached,” the U.S. official added.
A new report by Capital Economics which examines the relationship between the US dollar, trading at near 12-year highs against the euro, and the price of gold and argues that when the US starts to raise interest rates as it is expected to do perhaps as early as June could potentially "mean more upside for gold than the dollar:"
"The fallout from, say, a 25% rise in the gold price would be largely positive (including the boost to producers’ incomes and the favourable wealth effects). But the same rise in the dollar could have a significantly negative impact on the US economy, and prompt the Fed to delay raising interest rates. This asymmetry may be especially relevant in the event of a shock such as the break-up of the euro."
The report by Julian Jessop, Head of Commodities Research at the independent London-based research firm includes two charts showing the asymmetry of the relationship and how well gold has held up against the dollar like it did in the second half of 2008 and in the first half of 2010.
The second chart plots the gold price against Greek government bond yields as a proxy for euro-zone break-up risk. "This relationship has been more reliable than that between gold and the dollar," says Jessop, who is predicting gold will rise to $1,400 by the end of the year.
CHARTS: What will happen to gold price after Greek exit
Sourced :- Frik Els of MINING.com