The principles of technical analysis derive from the observation of financial markets over hundreds of years. The oldest known example of technical analysis was a method used by Japanese traders as early as the 18th century, which evolved into the use of Candlestick techniques, and is today a main charting tool.
Dow Theory is based on the collected writings of Dow Jones co-founder and editor Charles Dow, and inspired the use and development of modern technical analysis from the end of the 19th century. Modern technical analysis considers Dow Theory its cornerstone.
Many more technical tools and theories have been developed and enhanced in recent decades, with an increasing emphasis on computer-assisted techniques.
Principles of Technical Analysis
Market action discounts everything
Prices move in trends
History tends to repeat itself.
Definition of 'Candlestick'
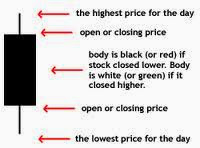
A chart that displays the high, low, opening and closing prices for a security for a single day. The wide part of the candlestick is called the "real body" and tells investors whether the closing price was higher or lower than the opening price (black/red if the stock closed lower, white/green if the stock closed higher). The candlestick's shadows show the day's high and lows and how they compare to the open and close. A candlestick's shape varies based on the relationship between the day's high, low, opening and closing prices.Definition of 'Bar Chart'
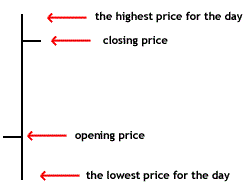
A style of chart used by some technical analysts, on which, as illustrated below, the top of the vertical line indicates the highest price a security traded at during the day, and the bottom represents the lowest price. The closing price is displayed on the right side of the bar, and the opening price is shown on the left side of the bar. A single bar like the one below represents one day of trading.


No comments:
Post a Comment